ETH/USD Elliott Wave technical analysis [Video]
![ETH/USD Elliott Wave technical analysis [Video]](https://editorial.fxsstatic.com/images/i/ETHEREUM_XtraLarge.png)
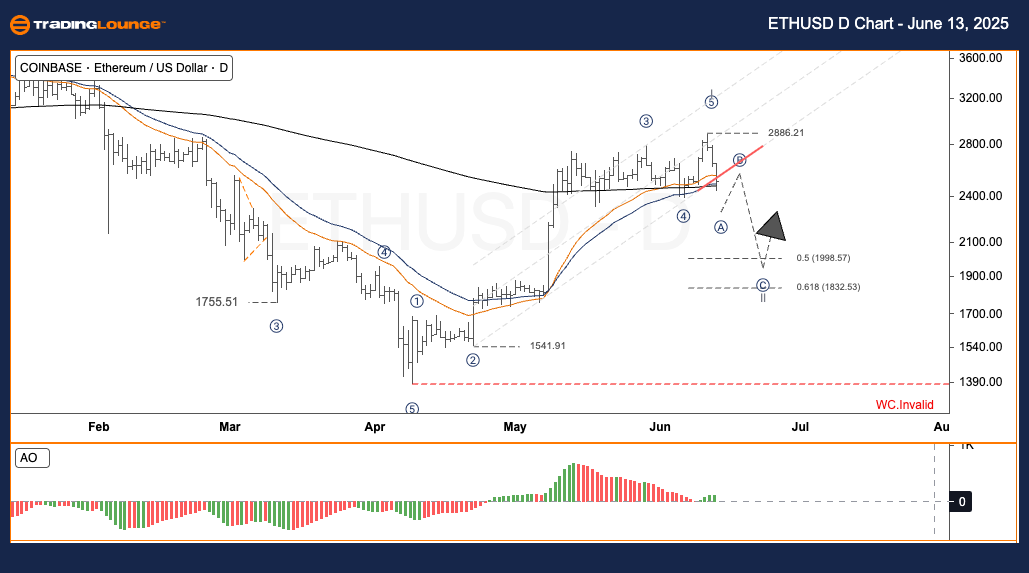
ETH/USD Elliott Wave analysis
Function: Follow Trend.
Mode: Motive.
Structure: Impulse.
Position: Wave 2.
Invalidation level: Not specified.
Ethereum's price rallied strongly through May, reaching a peak at $2,790. According to our Elliott Wave count, this marks the completion of Wave I, indicating the onset of Wave II, a corrective phase. Typically, this correction is deeper and lasts longer than the previous impulse wave.
-
Swing trade opportunity (Short-term traders)
Monitor for a reversal within the $1,830 to $2,000 support zone. Entry confirmation requires visible buying activity. -
Risk management
Stop-loss level: Not Available
ETH/USD Elliott Wave analysis
Function: Follow Trend.
Mode: Motive.
Structure: Impulse.
Position: Wave 2.
Invalidation level: Not specified.
This short-term view on the 4-hour chart aligns with the daily outlook. The correction from the $2,790 high indicates a classic Wave II pattern, offering swing trade opportunities as prices move lower toward key zones.
-
Swing trade strategy
Observe the $1,830–$2,000 price range for bullish reversal signs to confirm trade entry. -
Risk management
Stop-loss level remains undefined.

ETH/USD Elliott Wave analysis [Video]
Author

Peter Mathers
TradingLounge
Peter Mathers started actively trading in 1982. He began his career at Hoei and Shoin, a Japanese futures trading company.


