|

ETC/USD Technical Analysis: Bulls continue their march

ETC/USD daily chart

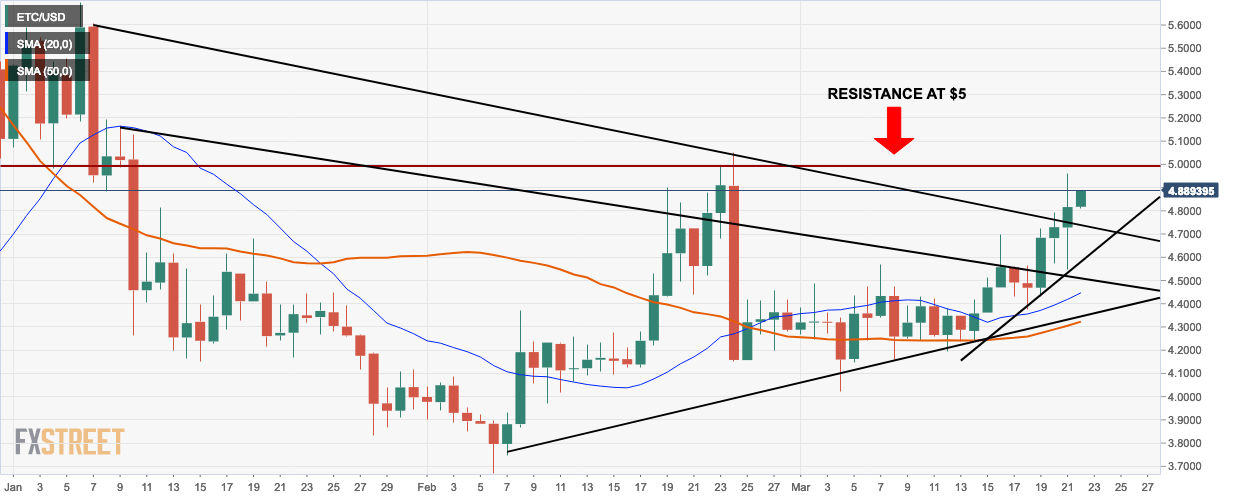
  • ETC/USD market opened at $4.89 this Friday.
  • The bulls have taken control of the market four days in a row.
  • Immediate resistance lies at $5.
  • The price is trending above both the 20-day simple moving average (SMA 20) and SMA 50 curves.

ETC/USD 4-hour chart

  • The 4-hour ETC/USD market is consolidating in a flag formation and is ready for a breakout.
  • There was a notable crash four sessions ago, however, the bullish sentiment is so high, that not only did the market recover, but the Elliot wave remained in the bullish territory.
  • According to the moving average convergence/divergence (MACD) histogram, the market momentum remains bullish.

ETC/USD hourly chart

  • The ETC/USD hourly chart shows that there have been multiple times when the bears tried to take control of the market. There is a very notable flash crash as well.
  • Each time, the bulls were able to thwart the bears and keep the overall sentiment bullish.
  • The relative strength index (RSI) curve is trending between the neutral and overbought zone.

Key Levels

  • Resistance3: $5.4136
  • Resistance 2: $5.1866
  • Resistance 1: $5.0014
  • Pivot Point: $4.7744
  • Support 1: $4.5892
  • Support 2: $4.3622
  • Support 3: $4.1770

Author

Rajarshi Mitra

Rajarshi Mitra

Independent Analyst

Rajarshi entered the blockchain space in 2016. He is a blockchain researcher who has worked for Blockgeeks and has done research work for several ICOs. He gets regularly invited to give talks on the blockchain technology and cryptocurrencies.

More from Rajarshi Mitra
Share:

Editor's Picks

Bitcoin, Ethereum and Ripple consolidate after massive sell-off

Bitcoin, Ethereum, and Ripple prices consolidated on Monday after correcting by nearly 9%, 8%, and 10% in the previous week, respectively. BTC is hovering around $70,000, while ETH and XRP are facing rejection at key levels. Traders should be cautious: despite recent stabilization, upside recovery for these top three cryptocurrencies is capped as the broader trend remains bearish.

Ethereum: Trend Research capitulates, BitMine's Thomas Lee sees a V-shaped recovery

Ethereum had one of its sharpest historic declines over the past 10 days, shedding 40% of its value and briefly sliding below $2,000. The dip also saw ETH move below its realized price, or the average cost basis of investors — an occurrence that has historically accelerated selling pressure as investors cut losses.

Why Bitcoin and top cryptos are falling: Bitwise

The crypto market crash since October isn't down to a single factor but a combination of several, according to Bitwise CIO Matt Hougan. In a note to investors on Friday, Hougan outlined six key factors that potentially contributed to the crash that pushed down nearly every top crypto by more than 50% from prices seen over four months ago.

XRP recovery gains momentum despite retail market decline

Ripple is accelerating its recovery, trading above $1.36 at the time of writing on Friday, as investors adjust their positions following a turbulent week in the broader crypto market. The remittance token is up over 21% from its intraday low of $1.12.

Bitcoin Price Annual Forecast: BTC holds long-term bullish structure heading into 2026

Bitcoin (BTC) is wrapping up 2025 as one of its most eventful years, defined by unprecedented institutional participation, major regulatory developments, and extreme price volatility.

Bitcoin: The worst may be behind us

Bitcoin (BTC) price recovers slightly, trading at $65,000 at the time of writing on Friday, after reaching a low of $60,000 during the early Asian trading session. The Crypto King remained under pressure so far this week, posting three consecutive weeks of losses exceeding 30%.