Dogecoin price primed for a sharp move, but DOGE direction is unclear
- Dogecoin price consolidation becomes more transparent with two inside bars.
- Prominent bearish momentum divergence on the weekly Relative Strength Index (RSI).
- DOGE activist versus skeptic dynamic awards speculators with rough boundaries.

Dogecoin price responded emphatically yesterday to three consecutive inside days by locking in an 18% gain after being up over 30% at one point. DOGE outlook is tilted bullish but not constructed on a feeble thesis of never-ending social media hype from leading activists.
Dogecoin price race from obscurity is multiplying the riches of miners
An examination of the new addresses created for DOGE shows a parabolic spike from April 5 to April 12, before the price rally in the middle part of April. Since April 12, the number of new addresses has halved. However, the number remains above the sharp 2021 trend line and well above the gentler 2020-2021 trend line, indicating that retail investors are still attracted to the altcoin’s promises of endless riches.
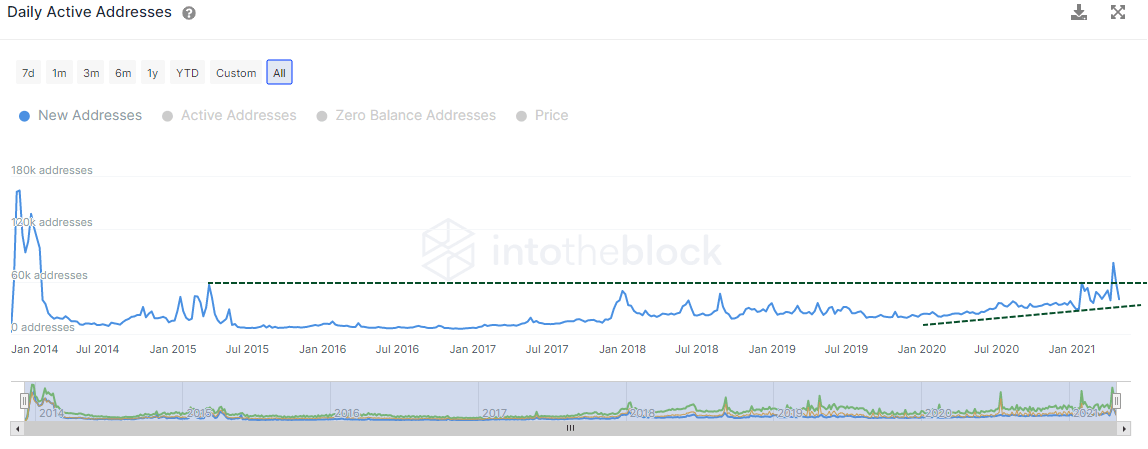
DOGE new addresses
The Intotheblock In/Out of the Money Around Price (IOMAP) metric shows 72.87k addresses bought 6.96 billion DOGE at an average price of $0.303, equating to where the price is currently trading.
One out-of-the-money cluster with an average price of $0.320 suggests some resistance at that level, but there is no other influential resistance.
Of interest for speculators, DOGE has forged consecutive inside bars on the 12-hour chart in the range of the two clusters mentioned above. Price compression leads to price expansion.
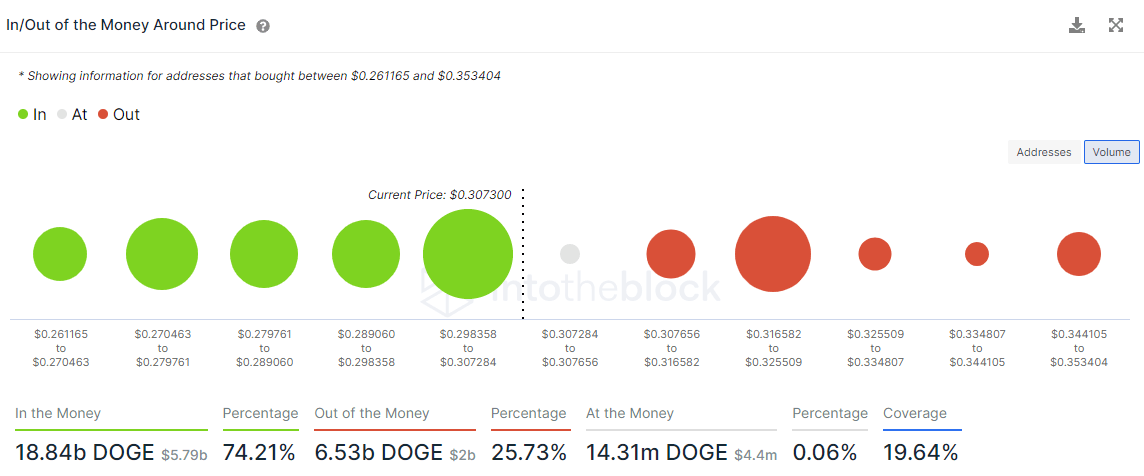
DOGE IOMAP metric
The 78.6% Fibonacci retracement of the April decline at $0.360 is critical resistance. It is the judge between which of the battling narratives will prove correct.
A decline below the minor trend line at $0.283 will induce some selling, but a trade below $0.255 will alter the bullish bias and raise the probability of a more complex path to $0.453. Alternatively, it could be a precursor to a new flash crash.
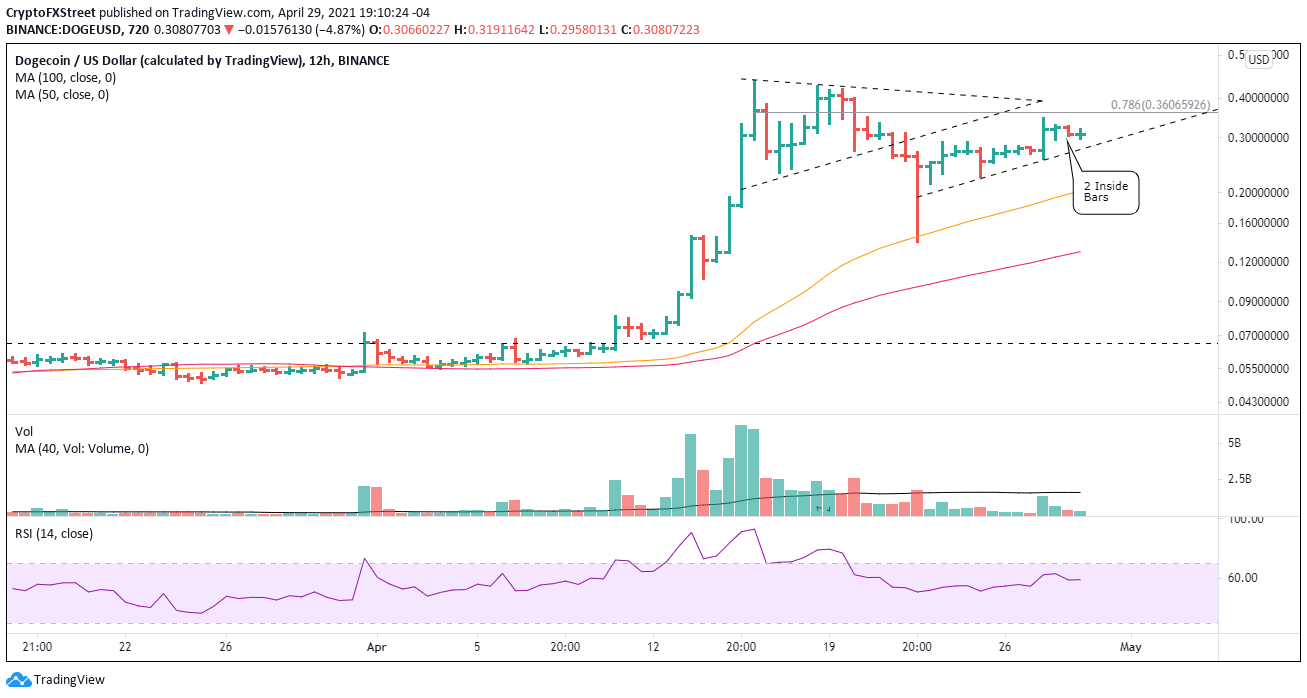
DOGE 12-hour chart
An FXStreet published yesterday discussed a third scenario. One in which DOGE follows the price precedent that it followed after the January explosive rally. More specifically, DOGE never retested the January high during the February rebound and slipped into a sideways price trend for two months.
Tough to see impatient activists and skeptics accepting a lateral resolution to their debate moving forward.
Author

Sheldon McIntyre, CMT
Independent Analyst
Sheldon has 24 years of investment experience holding various positions in companies based in the United States and Chile. His core competencies include BRIC and G-10 equity markets, swing and position trading and technical analysis.


