Dash price analysis: DASH/USD bounces up from the lower Bollinger curve
- The 20-day Bollinger jaw has widened, indicating increasing price volatility.
- The Elliott Oscillator has had 15 straight red sessions.

DASH/USD daily chart
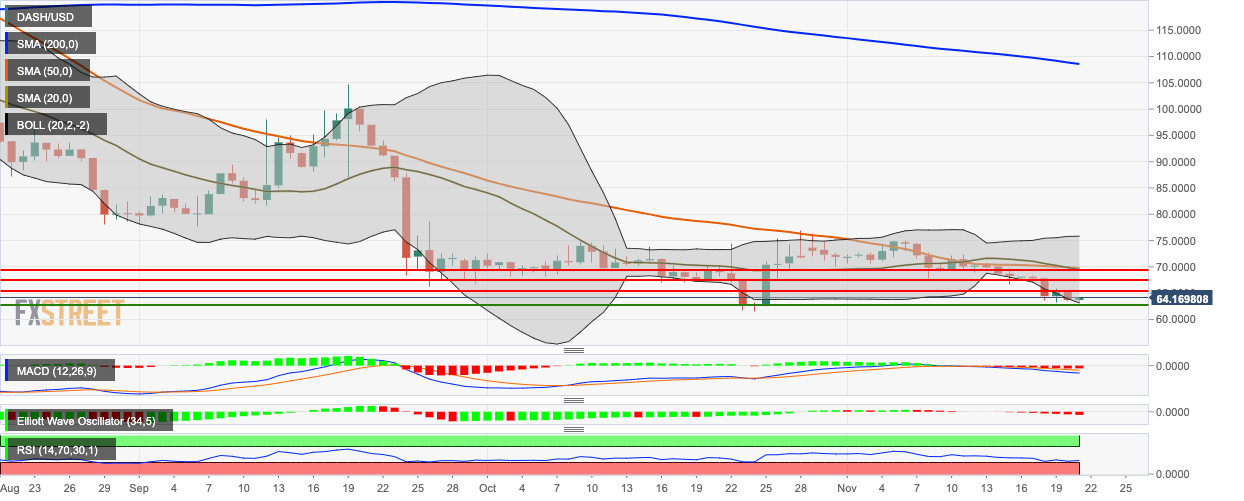
DASH/USD has bounced up from the lower Bollinger curve this Thursday, moving up from $63.70 to $64.15. The price is floating below the 200-day Simple Moving Average (SMA 200), SMA 50 and SMA 20 curves. The 20-day Bollinger jaw has widened, which indicates increasing price volatility.
The Elliott Oscillator has had 15 straight red sessions, while the Moving Average Convergence/Divergence (MACD) indicates sustained bearish momentum. The Relative Strength Index (RSI) indicator is trending around 35.10, next to the overbought zone.
Author

Rajarshi Mitra
Independent Analyst
Rajarshi entered the blockchain space in 2016. He is a blockchain researcher who has worked for Blockgeeks and has done research work for several ICOs. He gets regularly invited to give talks on the blockchain technology and cryptocurrencies.


