Cryptocurrencies cannot find buyers after Monday's selloff

After the massive cryptocurrency correction that started last Saturday and concluded yesterday, the crypto sector had lost over $40 billion in market capitalization. So, it was common sense to expect a bounce today, as is happening in the stock market worldwide, but it is not happening yet. Bitcoin (+0.14%) had a short 2% recovery from its $7,750 bottom, and most of the sector is still trying to find a bottom. The 24H heat map shows red across the chart, with slight glimpses of green. The most bullish is Steem (+18.2%) and MonaCoin(+7.6%), whereas all major coins are in the red compared to their 24H value, but also for the day. Ethereum Tokens are also mostly in the red, although there are notable exceptions, such as SNX (+9.4%) REP(+7.6%) and MKR(+3.9%).
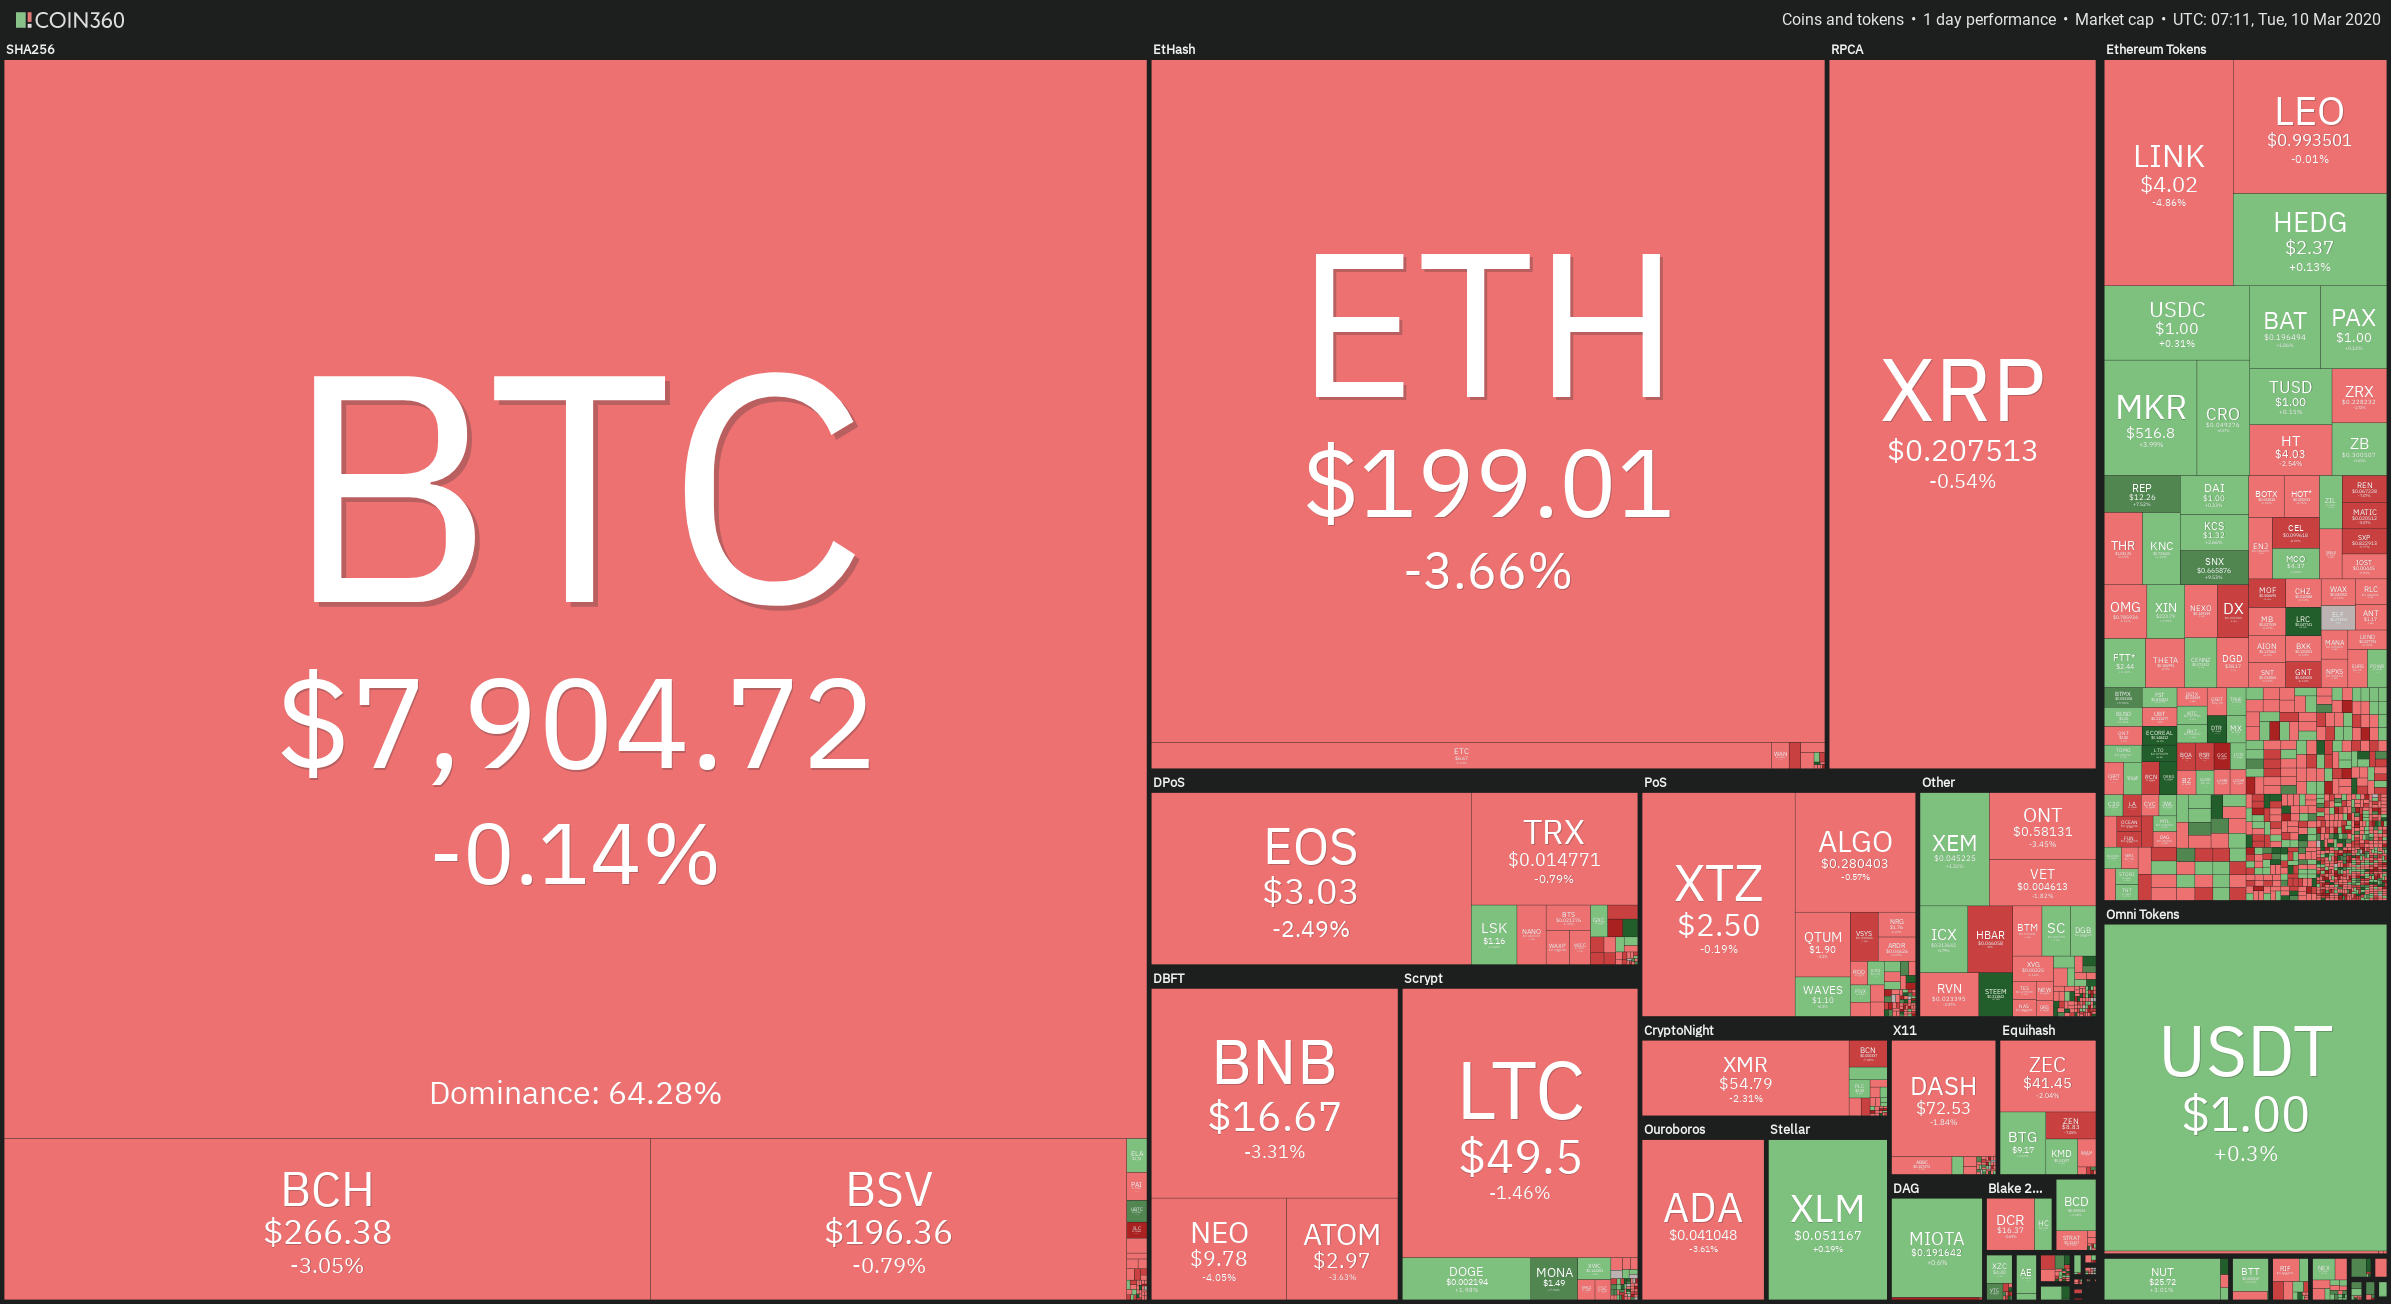
Fig 1 - Crypto Sector Heat Map
The Market Capitalization is down by 2.63 percent compared to the last 24H value and is now $224.575 billion. In the previous 24H, the traded volume was $53.16 billion, a 1.5% change from its previous 24H value. Finally, Bitcoin dominance holds at 64.23%.
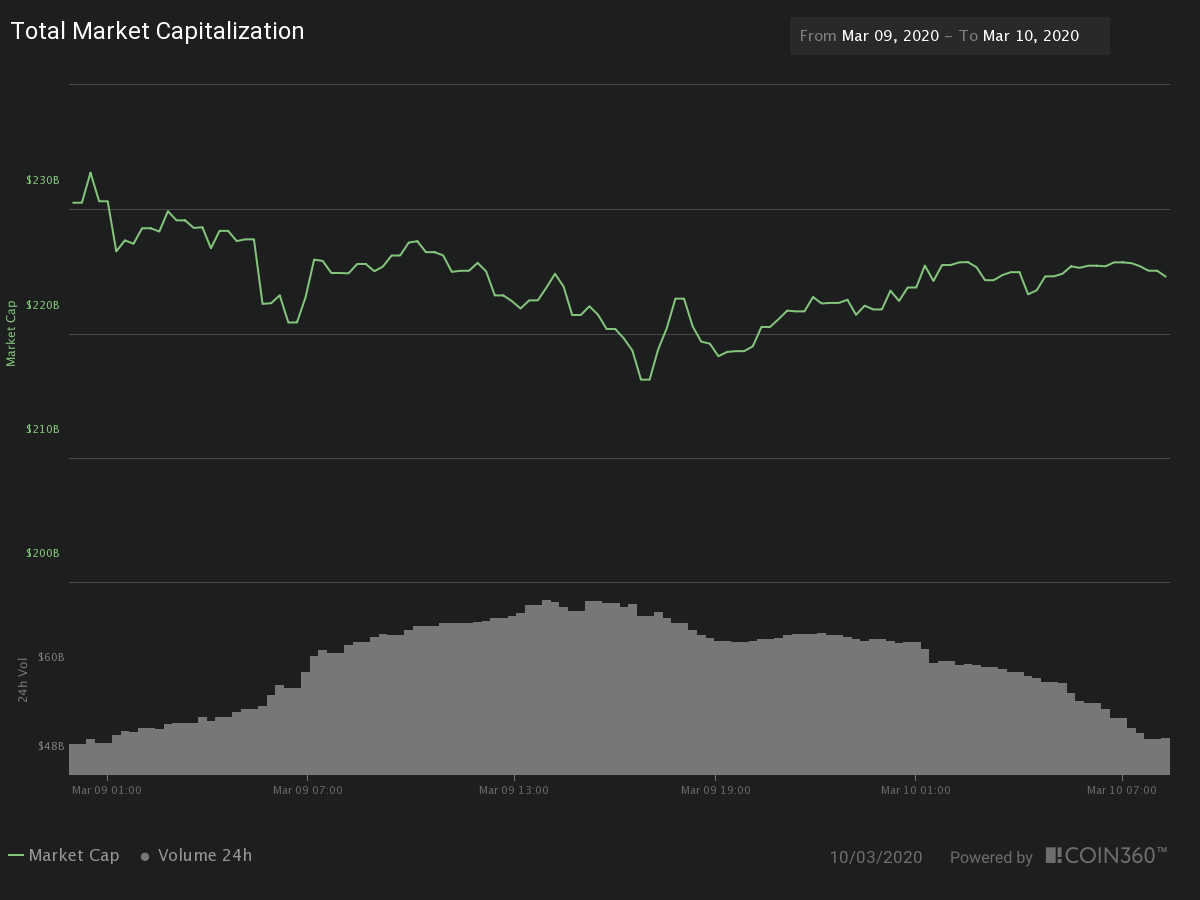
Fig 2 - Crypto Sector Market Cap and Traded Volume
Hot News
Plus token scam blamed for the last slump of the crypto sector, as they continue dumping stolen BTC on the market. A report stated that the wallets linked to the Plus Token scam continue to unload BTC “en masse”, and worse yet, they still have lots of coins to dump.
Bitcoin mining difficulty, which is the adjustment to keep the time between blocks at about ten minutes, is increased today by a massive 7%. That increase also shows that ten-minute mark is really an upper limit, and most of the time, the block is created in less than that. That is why the latest adjustments are so high. As a consequence of this, the new date for Bitcoin mining is scheduled to happen four days earlier.
Technical Analysis - Bitcoin
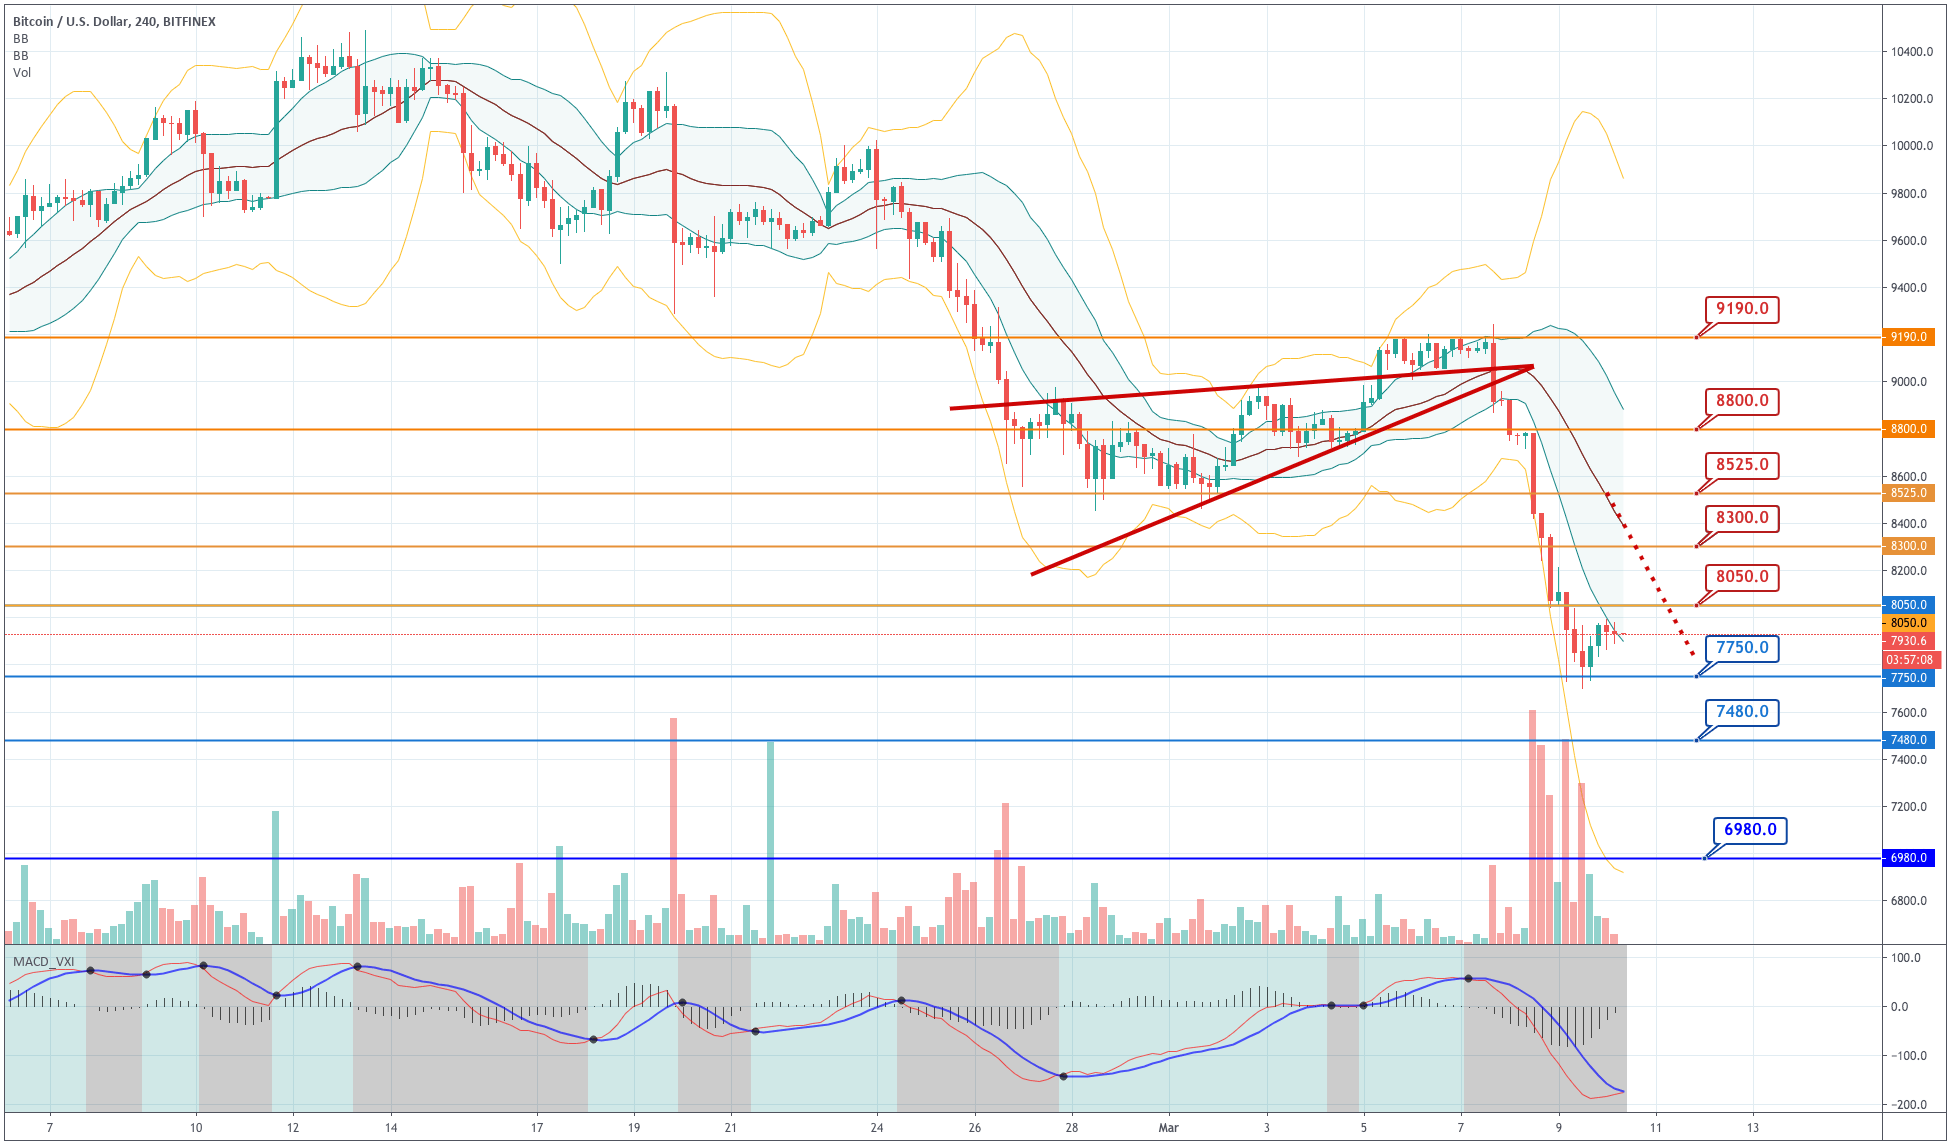
Chart 1 - Bitcoin 4H Chart
Bitcoin had an engulfing 4H candle after the price bounced off from the $7,750 level and continued to climb to touch the -1SD Bollinger line. Then, the price stalled. The volume has shrunk dramatically, so, as long as this does not change, the outlook is still very bearish. The levels to consider are $8,080 and $7,750. The MACD suggests sideways movement in the short term.
|
SUPPORT |
PIVOT POINT |
RESISTANCE |
|
7,750 |
8,050 |
8,300 |
|
7,200 |
8,525 | |
|
6,980 |
8,800 |
Ethereum
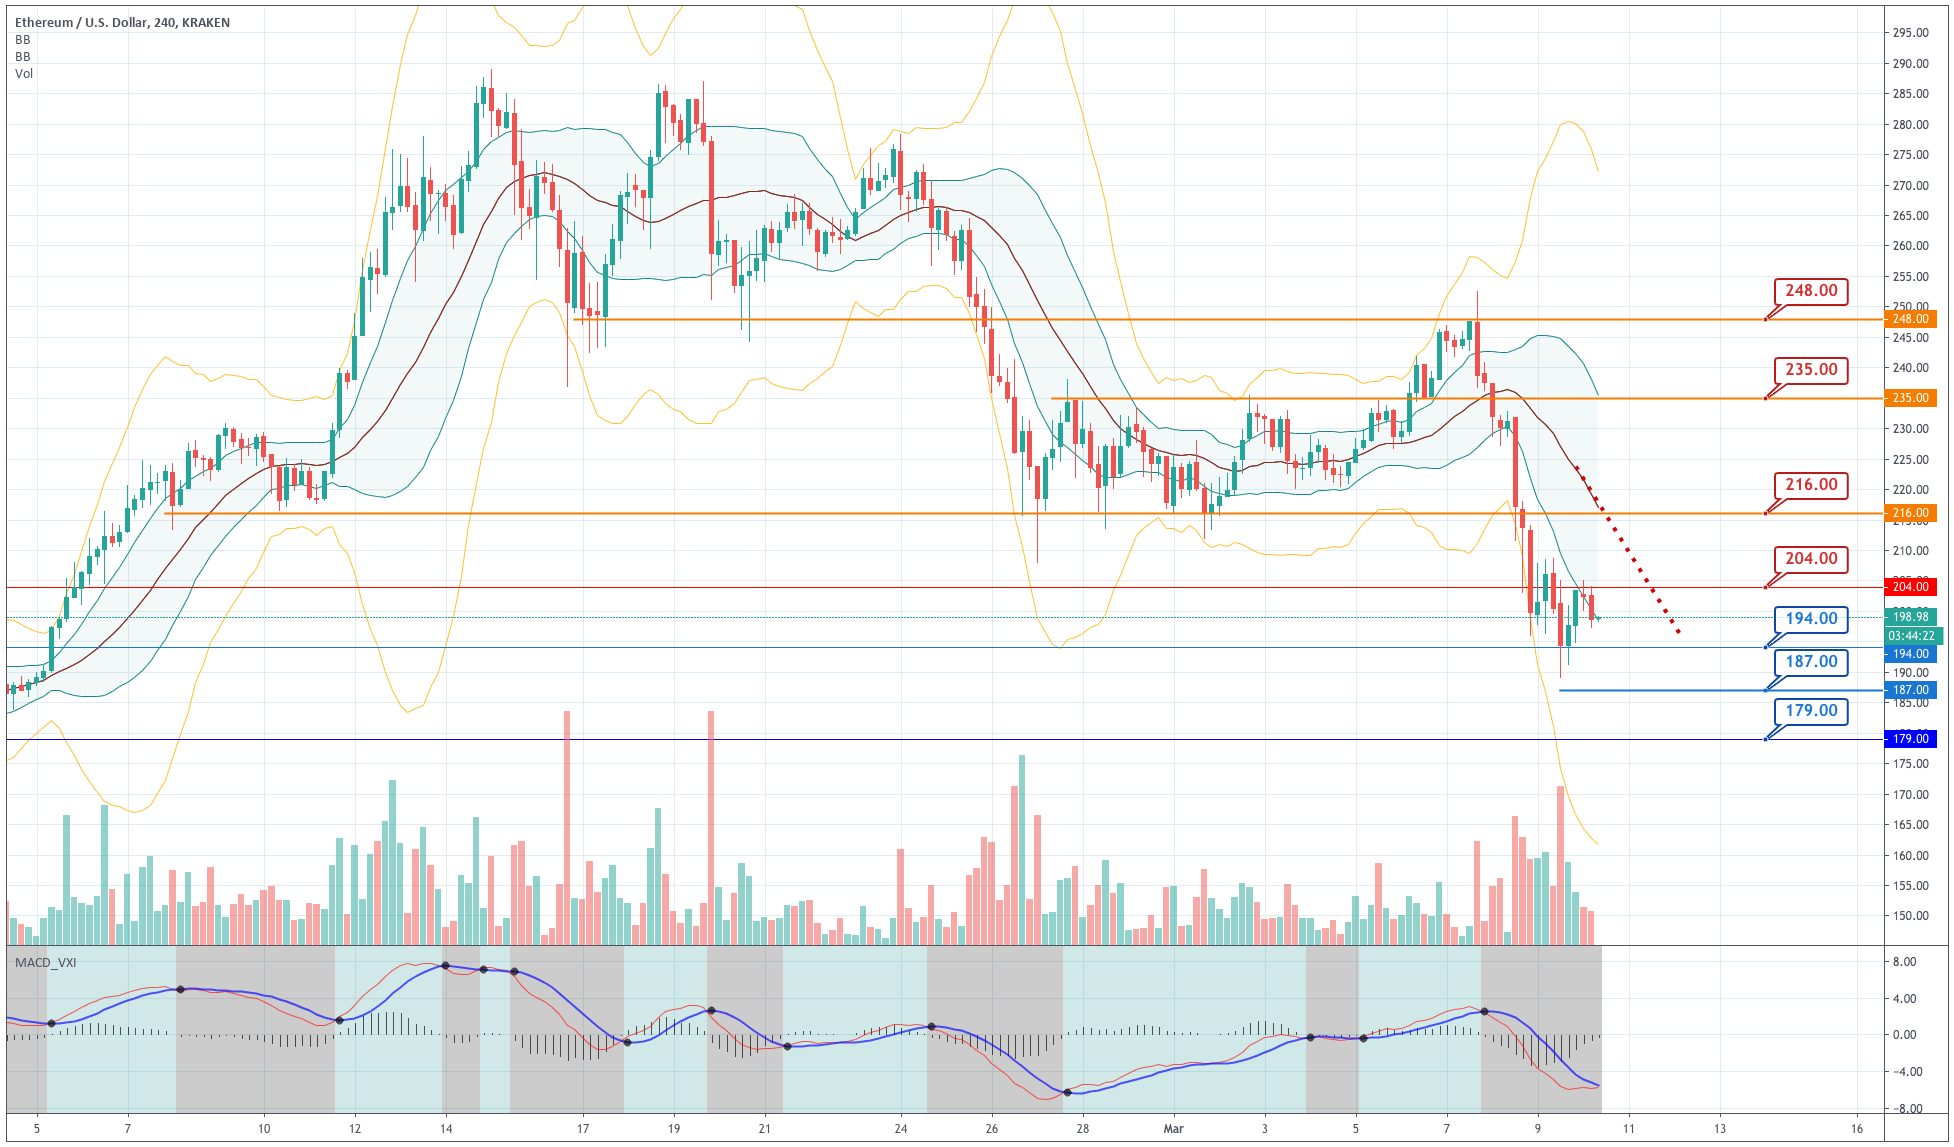
Chart 2 - Ethereum 4H Chart
Ethereum had two bullish candles as it bounced off from its bottom of $189. The price backed again after touching its -1SD Bollinger line. The MACD crossover may also suggest a sideways price action for some time, but the technical and price-action factors point to a bearish bias.
|
SUPPORT |
PIVOT POINT |
RESISTANCE |
|
194 |
204 |
216 |
|
187 |
235 | |
|
179 |
248 |
Ripple
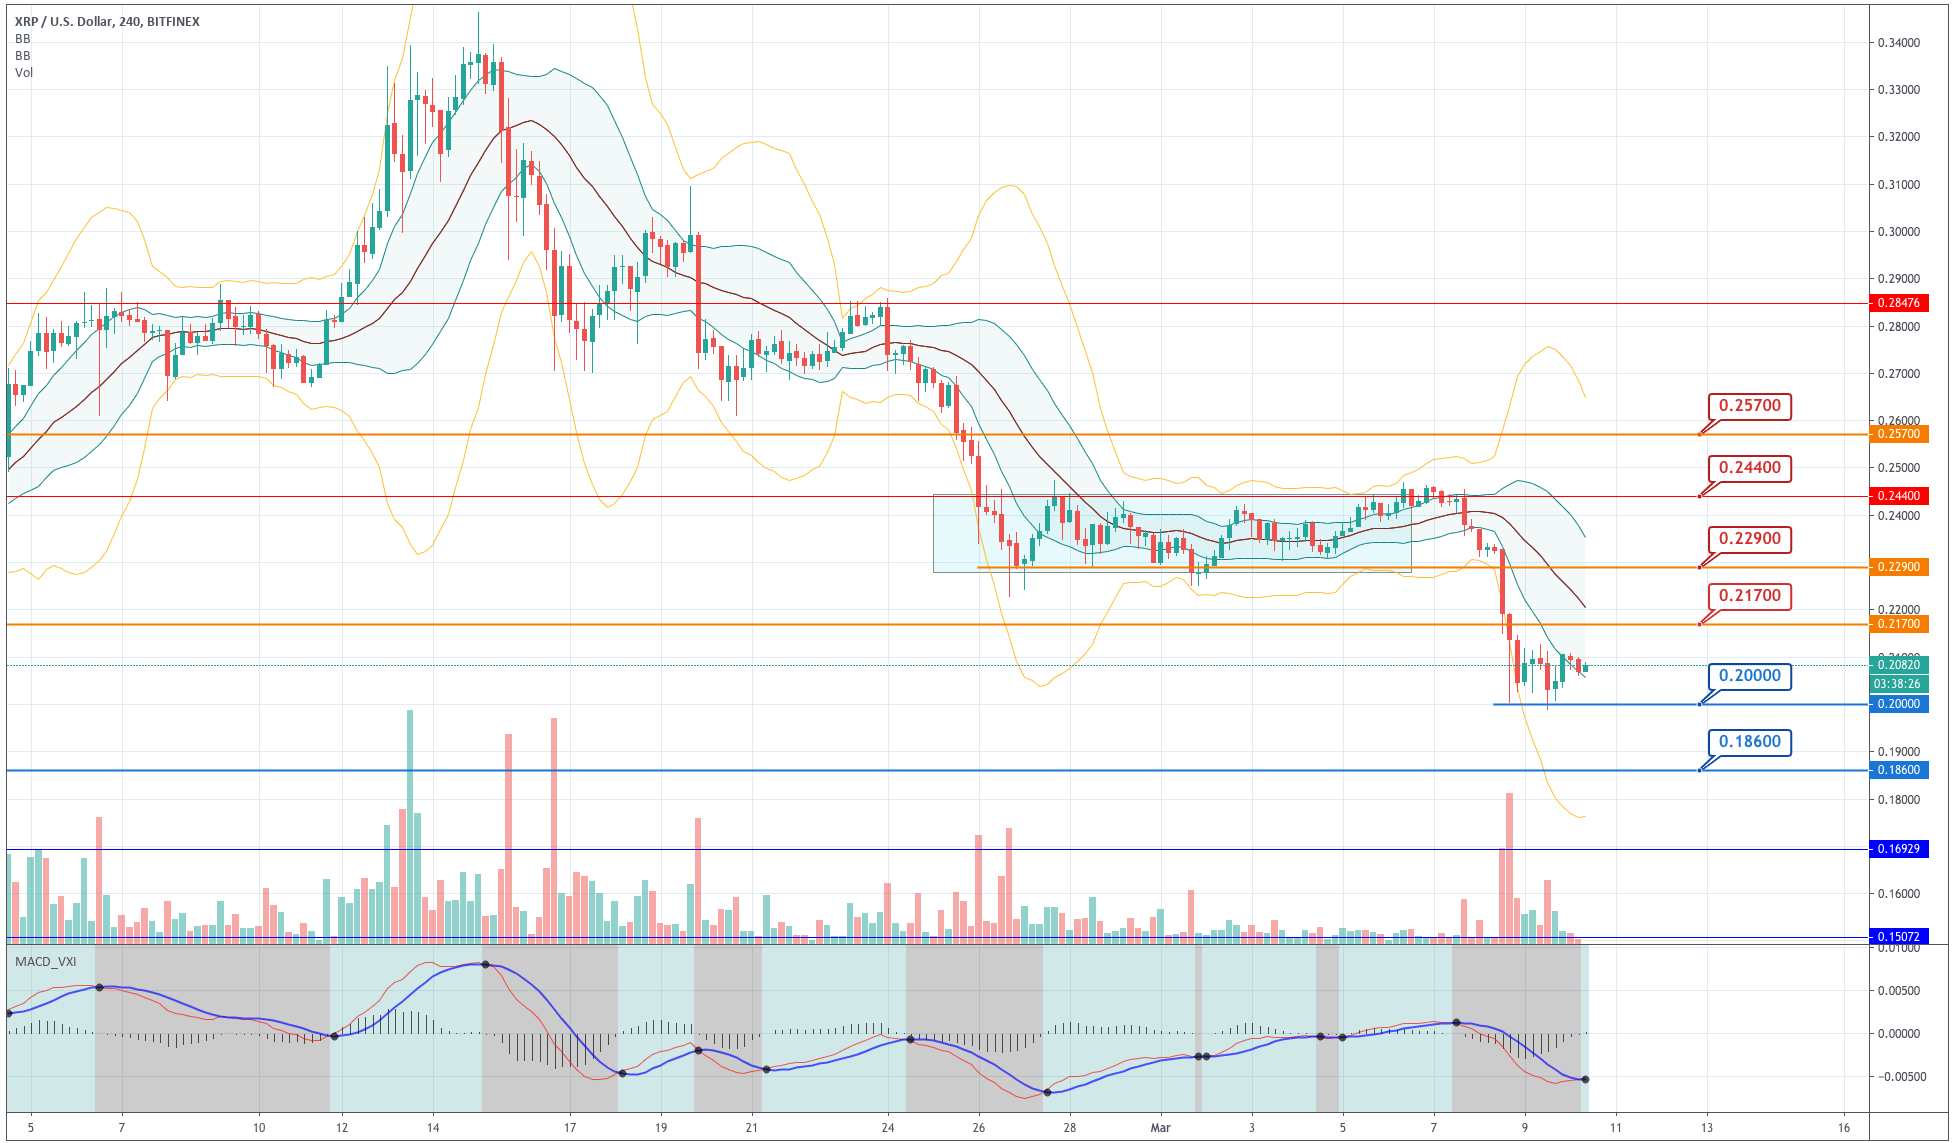
Chart 3 - Ripple 4H Chart
Ripple is moving sideways slightly above its $0.20 level. Its price moved from its -3SD Bollinger line to then -1SD line. The MACD also made a bullish crossover. Thus, as in the previous cases, we think the sideways action will continue and even find some strength up to 0.217. The current bias is negative, although the $0.20 is a strong support for this asset.
|
SUPPORT |
PIVOT POINT |
RESISTANCE |
|
0.2000 |
0.2070 |
0.2170 |
|
0.1920 |
0.2222 | |
|
0.1860 |
0.2290 |
Chainlink
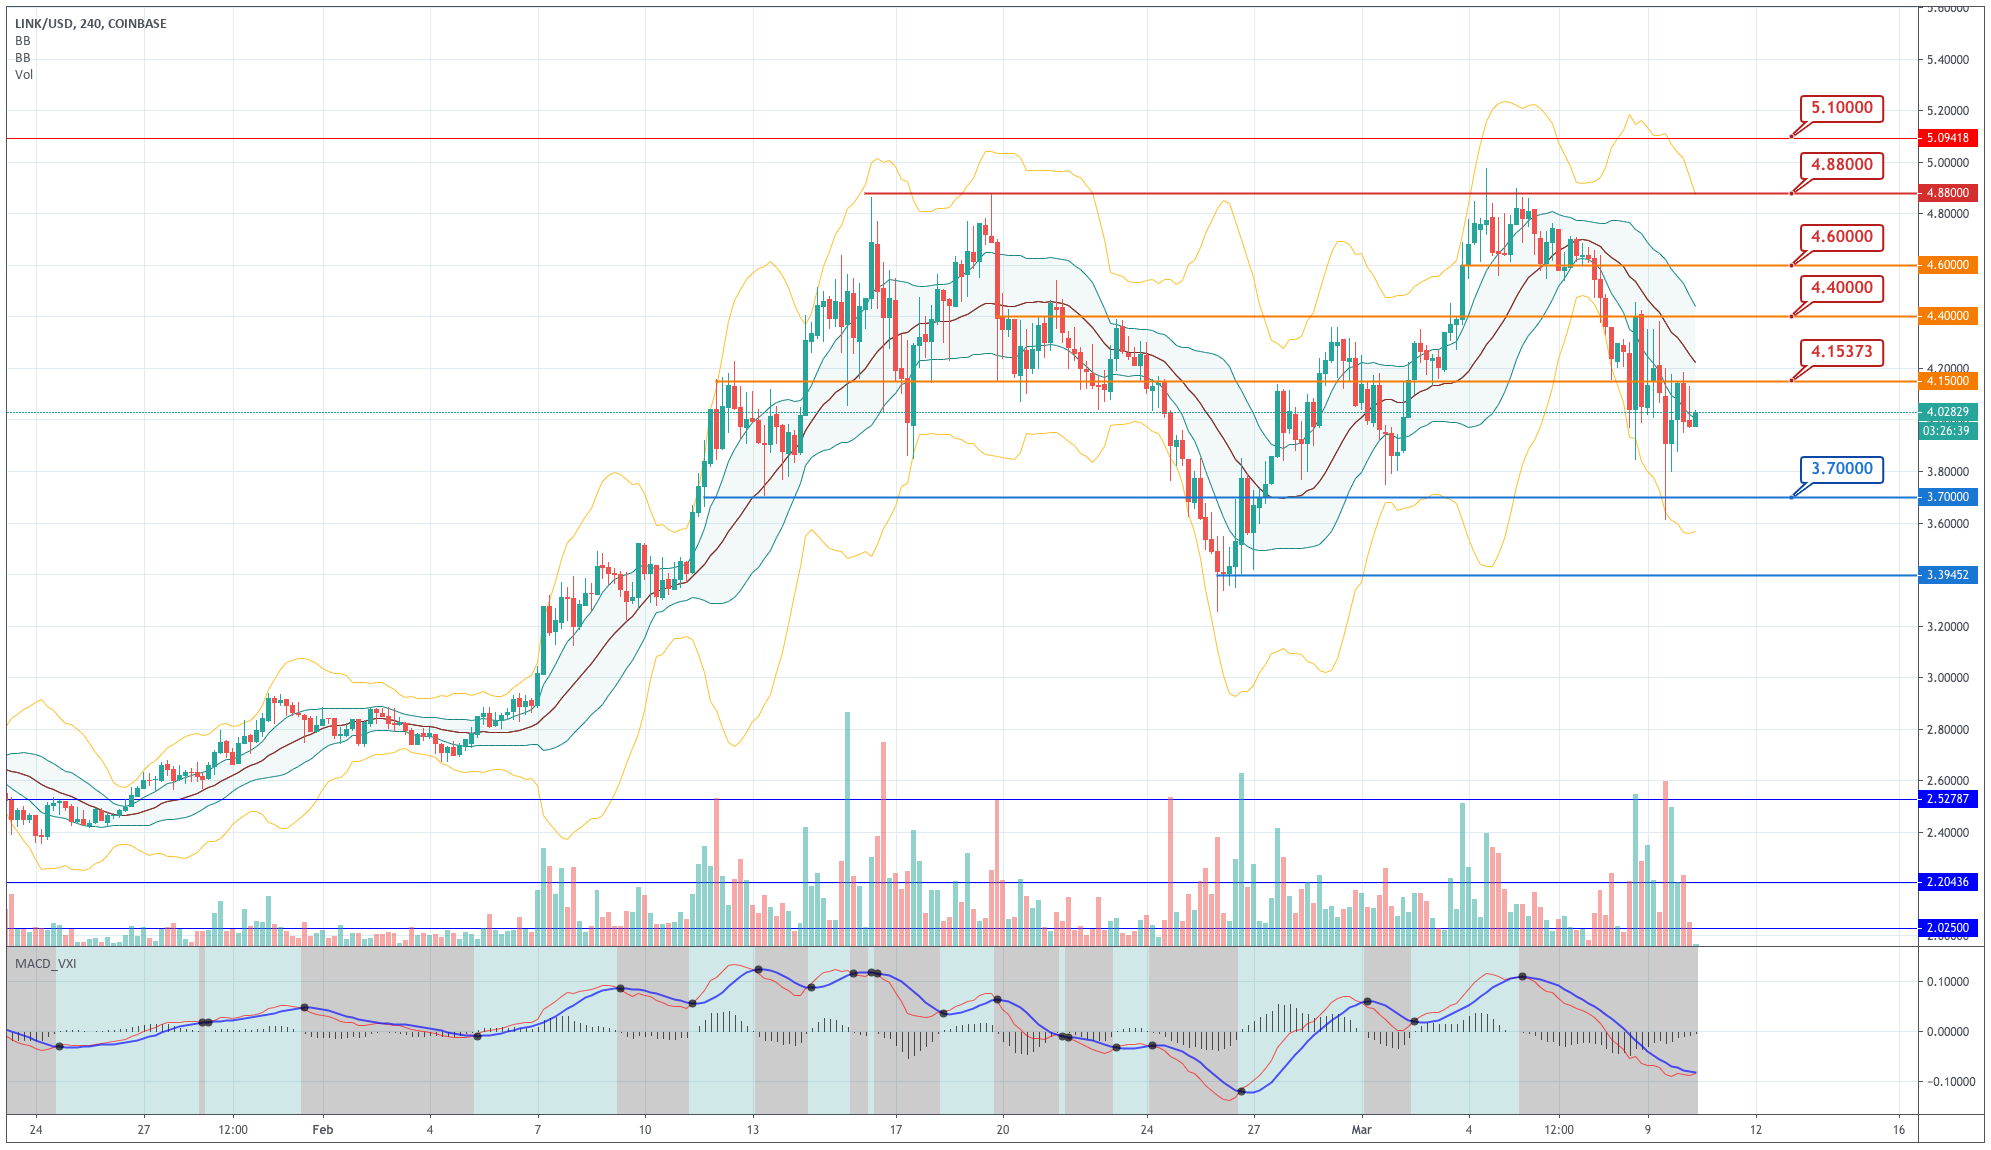
Chart 4 - Chainlink 4H Chart
Chainlink has been dragged down by the sector selloff, and its price continued descending. After a strong bounce off the $3.7 level, the circle has made a move to the $4.15 level, and now it is moving sideways. The price continues being close to the -1SD Bollinger line, which shows us the retracement has not ended. That said, the upward trend is still intact, and when the strength comes to the sector, we will see this asset move up above the average of the market.
|
SUPPORT |
PIVOT POINT |
RESISTANCE |
|
3.7 |
4.15 |
4.4 |
|
3.39 |
4.6 | |
|
3.2 |
4.88 |
Author

EagleFX Team
EagleFX
EagleFX Team is an international group of market analysts with skills in fundamental and technical analysis, applying several methods to assess the state and likelihood of price movements on Forex, Commodities, Indices, Metals and




