Chiliz Price Prediction: CHZ in no-trade zone while on-chain metrics brew bearish momentum
- Chiliz trades between the 50 SMA and the 100 SMA on the four-hour chart.
- A downfall in the network’s active addresses spells doom for CHZ as declines loom.
- The Parabolic SAR indicator has a bullish impulse, suggesting that bulls are in control.

Chiliz has been stuck in consolidation for almost two weeks now. Attempts to recover toward all-time highs of $0.91 have been thwarted, although immense support has been accorded to the bulls. Meanwhile, CHZ is doddering at $0.51 and looking forward to a breakout from the consolidation.
Two technical levels limit Chiliz price action
Chiliz has embraced immediate support at the 50 Simple Moving Average (SMA) on the four-hour chart. This buyer congestion area is keeping sellers in check. On the other hand, the 100 SMA caps movement north, delaying recovery.
The Moving Average Convergence Divergence (MACD) indicator reinforces the consolidation as it moves laterally at the mean line. For now, CHZ does not have a bearish or bullish bias. The MACD line (blue) crossing above or below the signal line will indicate if Chiliz will turn bearish or bullish in the near term.
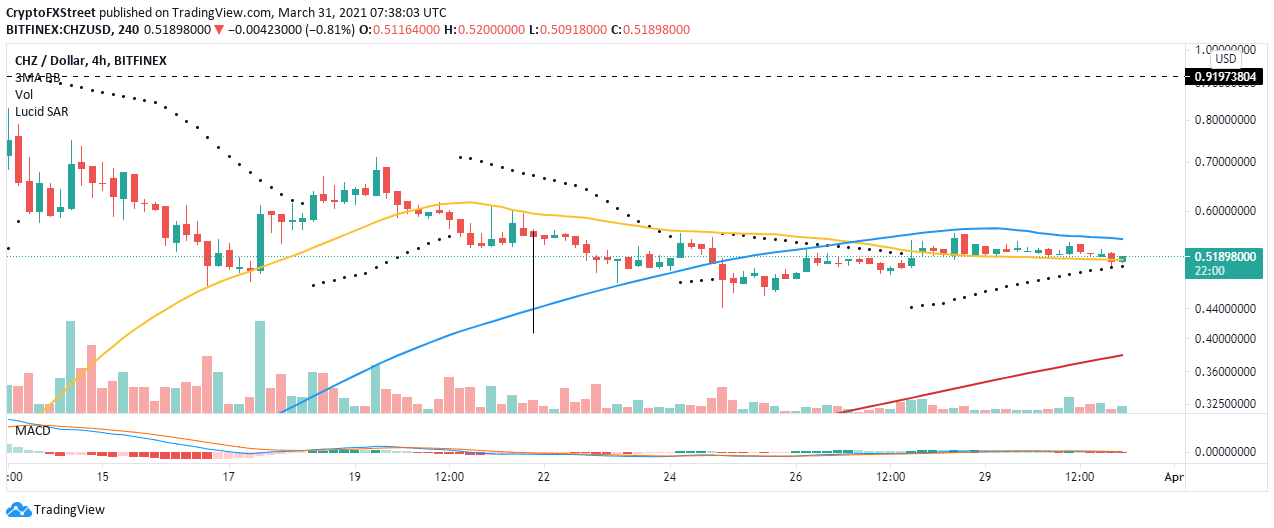
CHZ/USD four-hour chart
Chiliz bearish outlook
The number of active addresses on the network has been on a downward roll since mid-March. According to Santiment’s 24-hour active addresses metric, nearly 1,700 addresses are actively interacting on the network. This figure has dropped massively from roughly 6,400 on March 14, representing a 73.4% decline.
Note that as active addresses decrease, speculation also goes down. Thus, the token lacks the tailwind to recover; therefore, the CHZ price may continue with the downtrend if the downward trend in addresses progresses.
%20%5B10.26.37%2C%2031%20Mar%2C%202021%5D.png)
Chiliz active addresses
The bearish outlook has also been highlighted by IntoTheBlock’s IOMAP model, which shows immense resistance between $0.53 and $0.546. Here, nearly 4,400 addresses bought roughly 755 million CHZ. Although breaking above this zone would be an uphill task, if broken, CHZ may confirm a bullish breakout toward $0.91.
On the downside, the lack of substantial support areas is a bearish signal. The zone between $0.5 and $0.51 is one of the weak anchors. It contains around 3,000 addresses, which previously purchased approximately 76.5 million CHZ. If broken, Chiliz may drop toward support at $0.4.
%201.jpg)
Chiliz IOMAP chart
Looking at the other side of the fence
Chiliz has a bullish impulse, according to the Parabolic SAR indicator. The technical trend indicator is holding below the price, suggesting that bulls are still in the game. Moreover, if the price stays above the 50 SMA on the four4-hour chart, we would start to see CHZ build momentum toward the 100 SMA. Price action above the resistance at the 100 SMA may validate an upswing to the record high.
Author

John Isige
FXStreet
John Isige is a seasoned cryptocurrency journalist and markets analyst committed to delivering high-quality, actionable insights tailored to traders, investors, and crypto enthusiasts. He enjoys deep dives into emerging Web3 tren


