Chainlink update: Key on-chain indicators predict nearly 10% recovery in LINK
- Chainlink on-chain metrics signal a recovery from the recent correction in LINK price.
- Supply on exchanges dropped nearly 3% in two weeks, likely reducing the selling pressure on Chainlink.
- MVRV ratio in the 30-day timeframe has dipped to the historical opportunity zone, supporting a recovery in LINK.
- LINK trades at $12.46 on July 8, Monday, adding 1% to its value on the day.

Chainlink (LINK) is down 12.39% this week, trading at $12.48 on Binance. The altcoin lost key support at $13.84 and a correction followed, pushing LINK to its July 5 low of $11.05. While whales dumped their Chainlink tokens, smaller investors scooped up the altcoin, buying the dip.
Chainlink’s on-chain metrics have turned bullish, per Santiment data. A price recovery is likely if accumulation continues and LINK resists a mass sell-off.
Chainlink trades at $12.46 at the time of writing.
These on-chain metrics support Chainlink price recovery
Chainlink’s supply on exchanges decreased by nearly 3% in the past two weeks per Santiment data. This is one of the metrics that supports a recovery in the altcoin.
The second key metric is Network Realized Profit/Loss. It identifies the net profit/loss of all trades in an asset on a given day. Analysts can observe whether traders are capitulating or taking profits, based on the spikes in NPL.
LINK traders have been capitulating, shedding their LINK holdings at a loss for nearly two weeks. Santiment data shows traders realized over $47 million in losses between June 24 and July 8, supporting likely capitulation.
 [09.43.59, 08 Jul, 2024]-638560162395904124.png)
LINK Supply on exchanges and Network Realized Profit/Loss
The Market Value to Realized Value (MVRV) metric on a timeframe of 30 days is used to identify the local tops/bottoms in an asset. LINK’s MVRV 30-day is negative 9.34%. MVRV 30-day is in a zone where LINK has typically noted price trend reversals, as seen in the Santiment chart below.
 [09.53.50, 08 Jul, 2024]-638560162673828701.png)
MVRV 30-day vs. LINK price
Chainlink eyes over 10% gains
Chainlink trades at $12.46, at the time of writing, on July 8, Monday. The altcoin lost key support at $13.84, and LINK slid to its multi-month low on July 5, at $11.05.
The $13.84 level coincides with the 23.6% Fibonacci retracement of Chainlink’s decline from its March 11 peak of $22.86 to its July 5 low of $11.05, as seen on the LINK/USDT daily chart. LINK recently dipped into the Fair Value Gap (FVG) between $11.62 and $12.11.
Chainlink collected liquidity in the FVG and is likely to make a comeback to the lower boundary of the imbalance zone between $13.73 and $14.24. This marks over 10% gains in LINK price.
The next key resistance is the psychologically important $16 level.
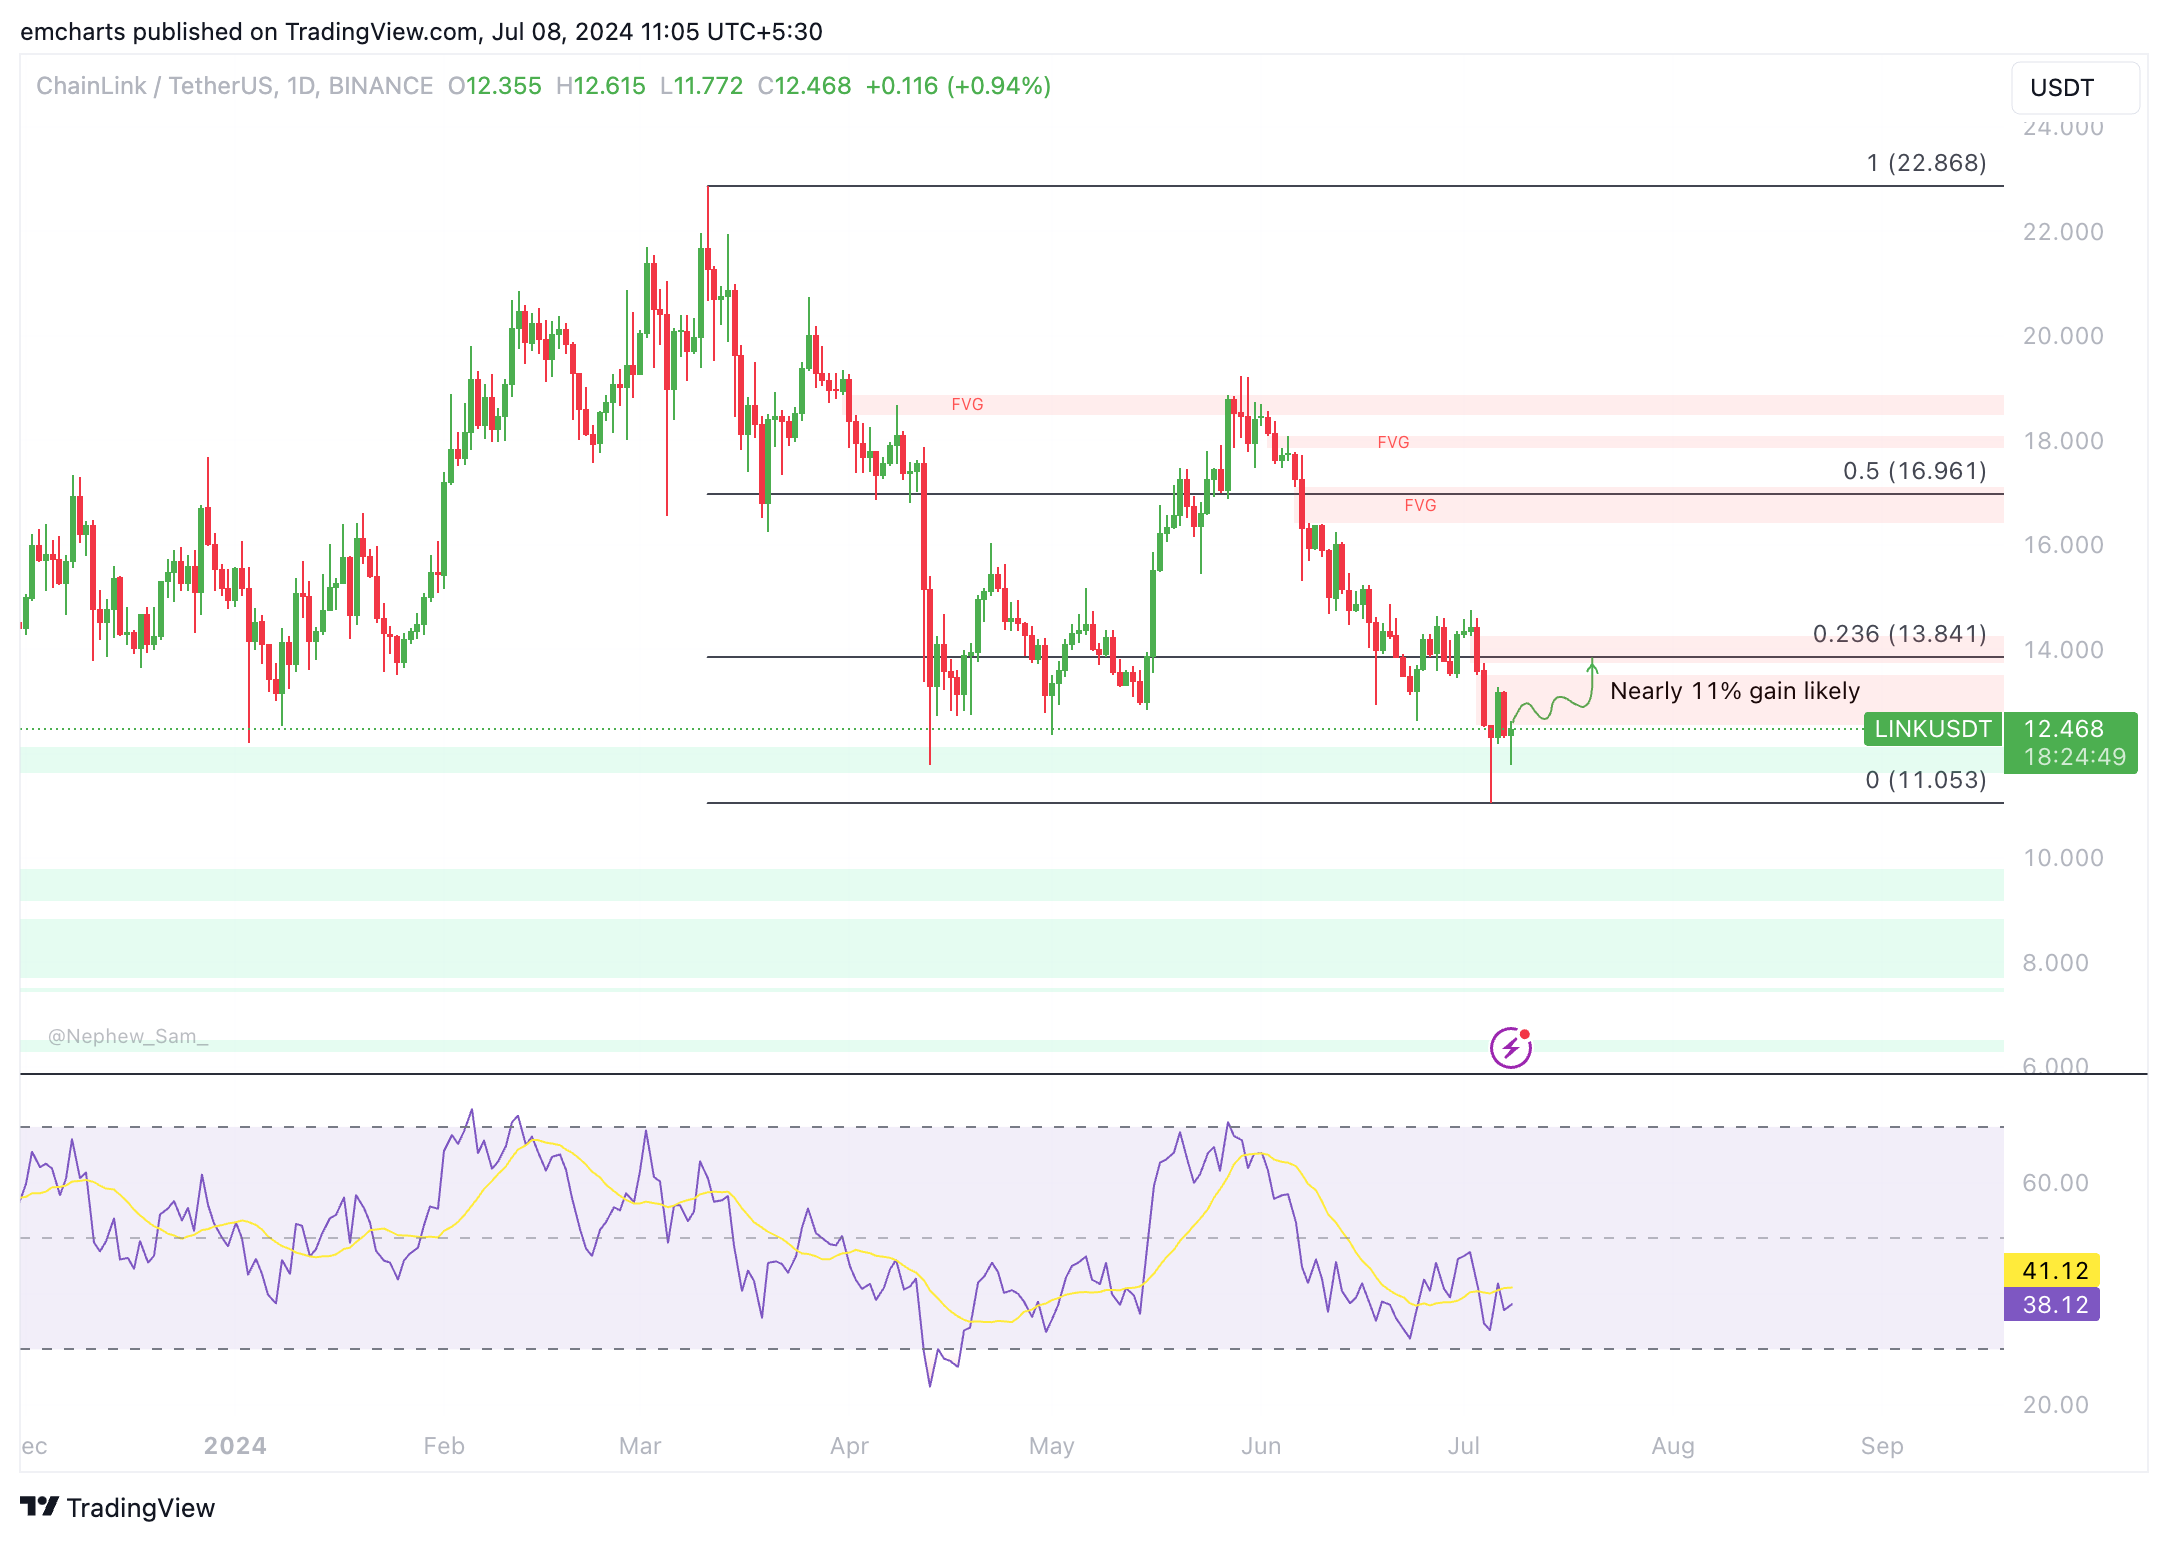
LINK/USDT daily chart
A daily candlestick close under $12.54 could invalidate the bullish thesis. Chainlink could dip to support at the July 5 low of $11.05.
Author

Ekta Mourya
FXStreet
Ekta Mourya has extensive experience in fundamental and on-chain analysis, particularly focused on impact of macroeconomics and central bank policies on cryptocurrencies.