Chainlink Price Prediction: LINK could re-test $10 but faces steep resistance ahead
- LINK is currently trading at $8.8 after a rejection from the psychological level at $10.
- Several buy signals have been presented on numerous time-frames, showing increased buying pressure.
-637336005550289133.jpg)
On September 24, LINK had a massive price spike from $7.4 to $10.53, climbing above the 100-SMA and turning it into support. Unfortunately, this level was lost on September 29 and the price started to decline shortly after.
LINK/USD daily chart
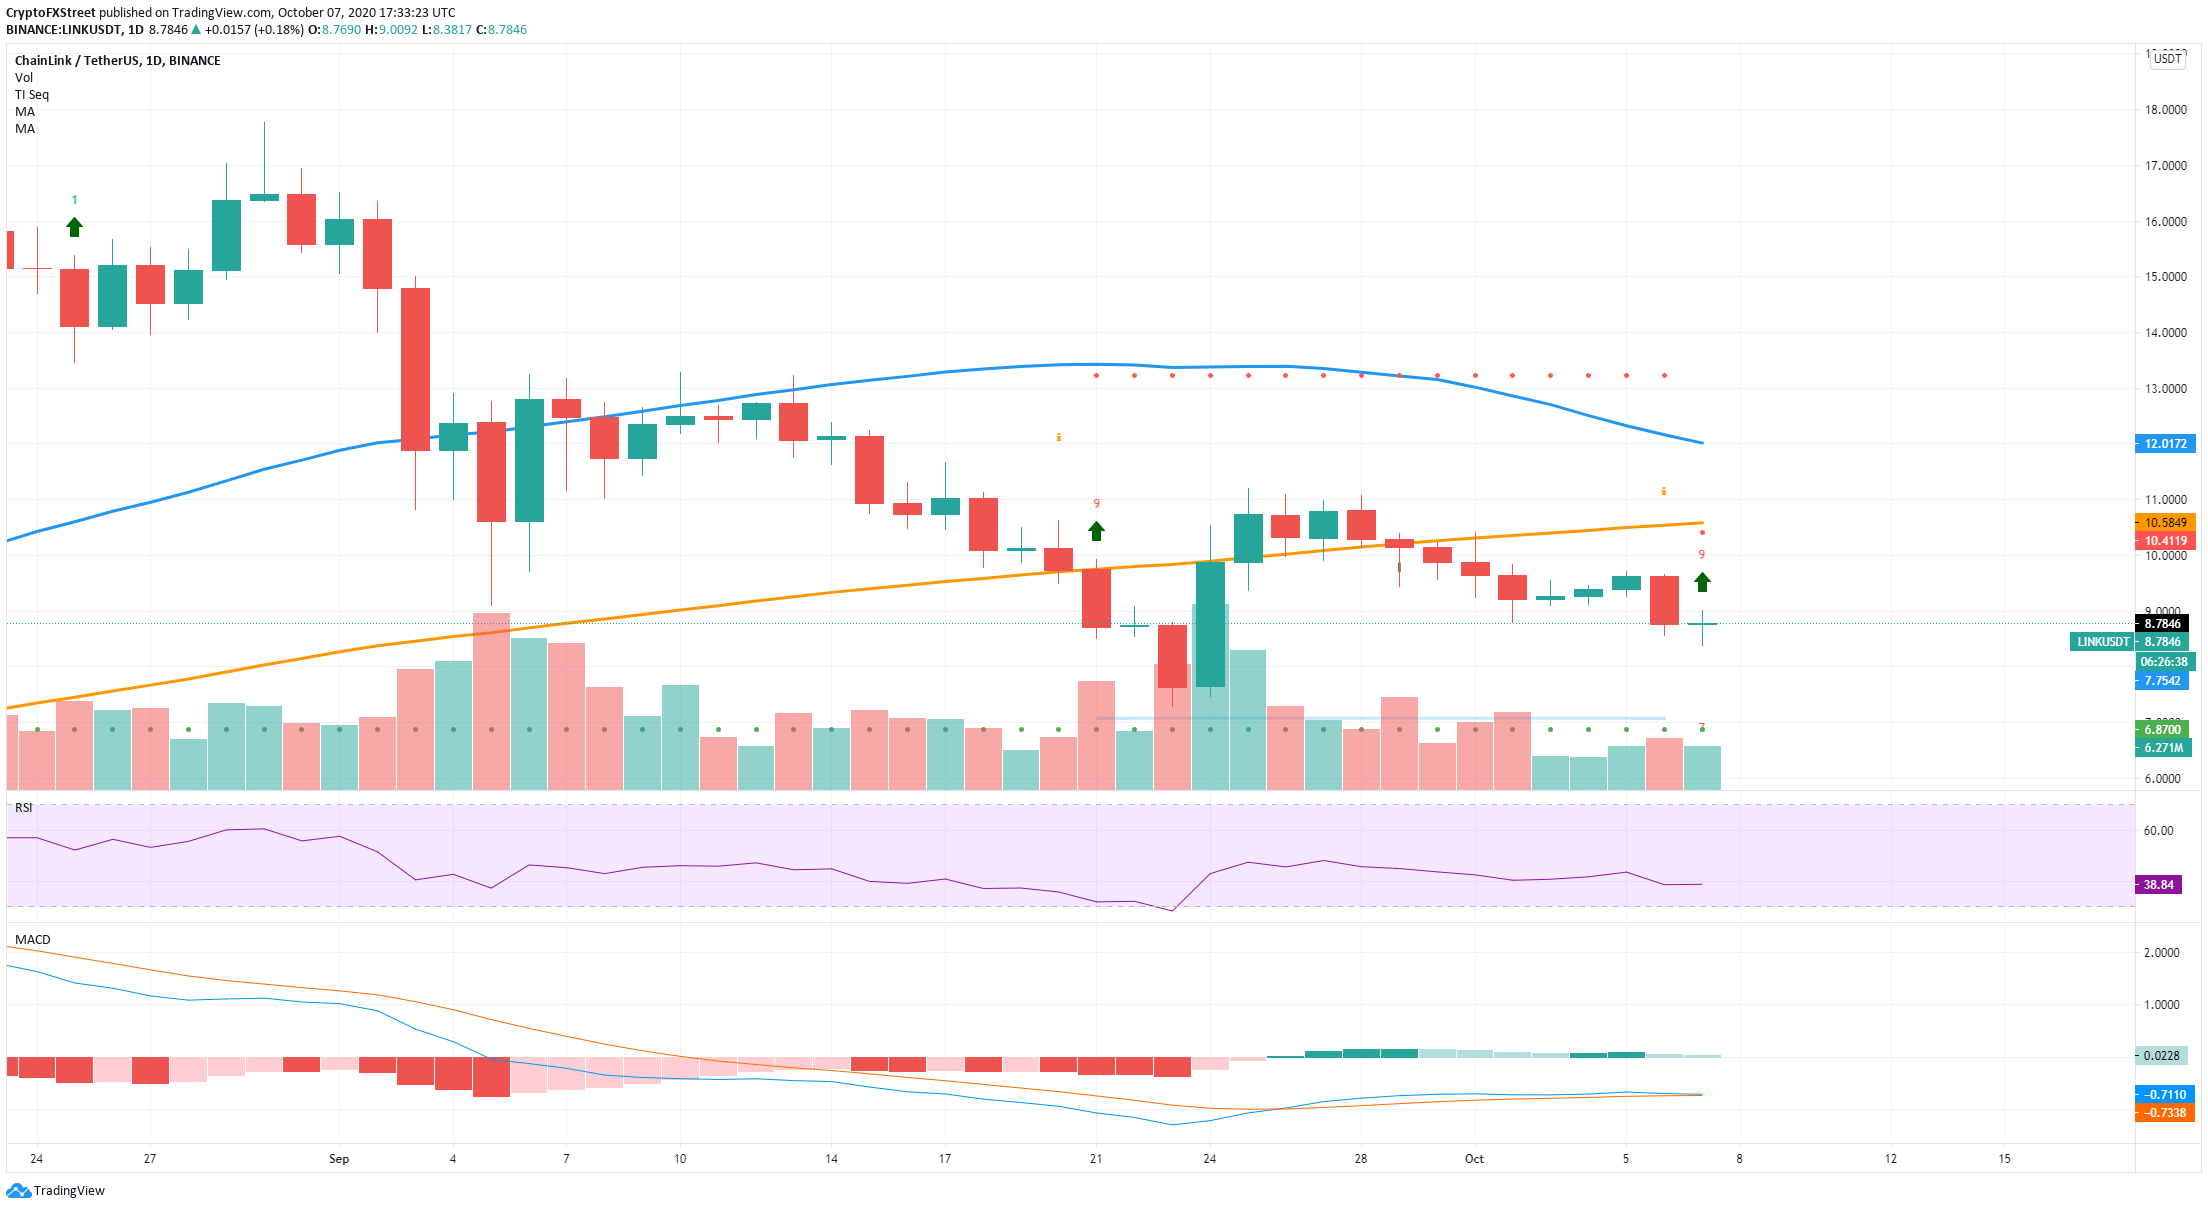
On the daily chart, the TD sequential indicator has just presented a buy signal. LINK is facing a lot of resistance at the 100-SMA at $10.58. An initial breakout above the high of $9.72 would validate the signal and perhaps push LINK above $10 into a re-test of the 100-SMA.
LINK/USD 4-hour chart
-637376896150536842.png)
Similarly, on the shorter-time frames, the TD sequential also presented other buy signals like the one on the 4-hour chart. The MACD seems to be slowly shifting in favor of the bulls but remains bearish. The last bullish cross pushed LINK around 6% to the upside.
Nonetheless, the price of LINK is still facing a lot of resistance levels. On the 4-hour chart, the 100-SMA and the 50-SMA are both acting as resistance levels.
LINK IOMAP Chart
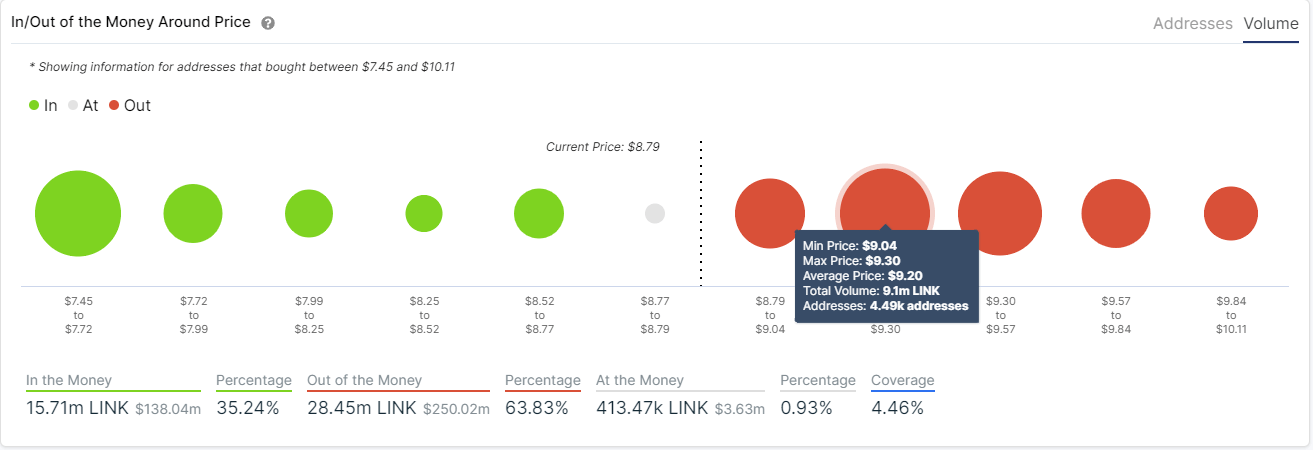
Additionally, the In/Out of the Money Around Price chart by IntoTheBlock shows several resistance areas above $8.79. For instance, the range between $9.09 and $9.30 represents the strongest area where 9 million LINK coins were purchased. On the support side, between $8.77 and $7.72 only 7.7 million LINKs were bought, a notable difference.
LINK New Addresses Chart
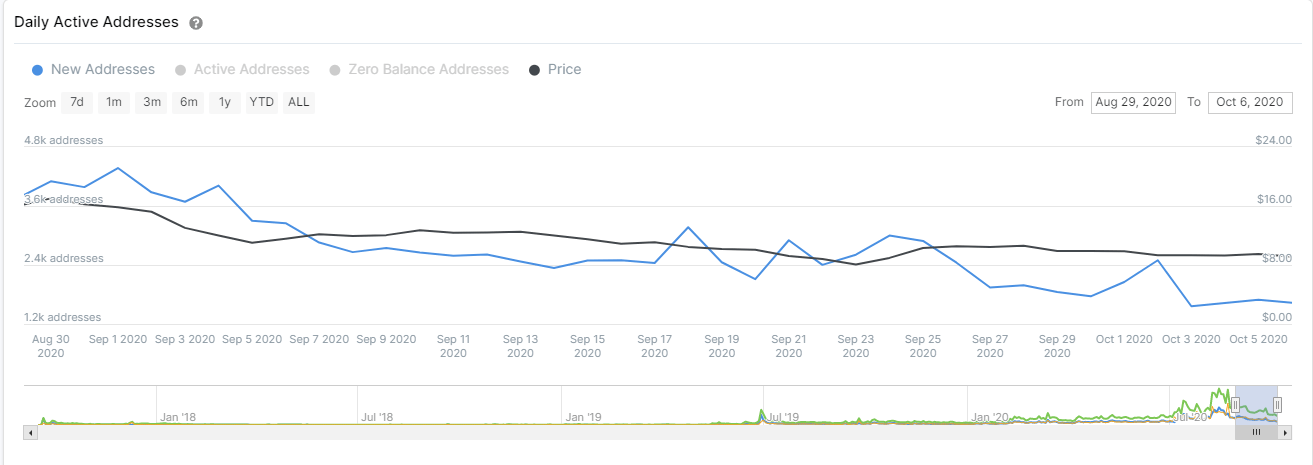
Furthermore, another concerning trend is the number of new addresses joining the LINK network. On September 1, around 4,300 addresses were coming in, however, this number has been declining significantly and it’s at a low of 1,630 now.
A breakout below $8.38 can send LINK towards the last low at $7.28 in the short-term.
On the other hand, if the buy signals presented by the TD sequential indicator are validated, LINK can climb towards $10 and re-test the 100-SMA on the daily chart at $10.58.
Author

Lorenzo Stroe
Independent Analyst
Lorenzo is an experienced Technical Analyst and Content Writer who has been working in the cryptocurrency industry since 2012. He also has a passion for trading.


