Chainlink Price Forecast: LINK bulls spectacular return aims for $11
- Chainlink renews its bullish narrative, spiking above $9 and closing in on the crucial $10.
- LINK’s upward momentum might be jeopardized by declining volume across its markets.
- On-chain analysis hints that gains above $10 may be difficult to achieve in the near term.
-637336005550289133.jpg)
After trading new all-time highs at $20, Chainlink embarked on a trip downstream. Tentative support levels such as $16, $12, and $10 tried to cushion the token from dropping further but to no avail. LINK continued with the breakdown reminiscent of the bleeding in the decentralized finance (DeFi) ecosystem.
Chainlink is a decentralized oracle network, providing smart contracts with secure access to data feeds, API’s, and payments. The DeFi tokens in the industry have significantly benefited from the live data provided by Chainlink.
LINK is teetering at $9.6, accruing over 7% in gains in the last 24 hours at the time of writing. On the upside, buyers are looking forward to stepping above $10. On the downside, the 100 Simple Moving Average (SMA) in the 4-hour timeframe is in line to provide immediate support.
Chainlink breakout seems sustainable
Following support established at $7, the decentralized oracle token sprung upwards, testing the barrier at $11. However, declines erased most of the accrued gains, culminating in losses towards $8. In the last few days, bulls have regained control of the price, resulting in a breakout above the descending wedge.
LINK/USD 4-hour chart
-637378125602571987.png)
A falling wedge is illustrated by drawing one trendline to mark the highs and another to mark the lows. The trendlines converge as the price downtrend momentum slows. Buyers start to come in and a breakout occurs before the lines meet. The action above this wedge pattern highlights a reversal in the trend, giving traders opportunities to capitalize on the move.
If the momentum above the wedge pattern is sustained, a break above $10 will put LINK into a trajectory aiming for $11. The Relative Strength Index appears to be slowing down on the uptrend, perhaps due to declining volume.
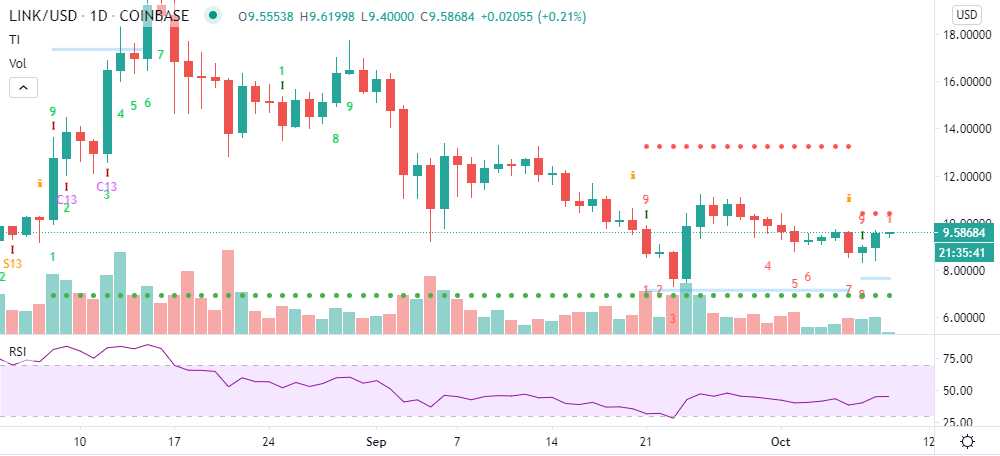
The TD Sequential indicator presented a buy signal in the form of a red nine candlestick. Following the signal, Chainlink shot up from $8.4 to the current price of $9.6. The uptrend has the potential to continue, but the buy signal can also be invalidated. Therefore, it is essential to wait for a confirmed breakout before going all-in on LINK.
LINK/USD daily chart
IntoTheBlock’s IOMAP model reveals a relatively smooth path to $10. However, the journey to $11 could delay due to the tough resistance between $10.4 and $10.7. Here, roughly 5,500 addresses previously purchased approximately 32 million LINK. The volume in this range is likely to absorb most of the buying pressure, delaying the rally.
Chainlink IOMAP chart
-637378126325086791.png)
On the flip side, LINK is sitting on an area of relatively strong support. The stacks of support levels carry the potential to halt declines if a reversal comes into the picture. Nonetheless, the most robust buyer congestion zone is highlighted at $8.7 - $8.9. Previously, nearly 3,800 addresses bought almost 11 million LINK.
Looking at the other side of the fence
It is worth mentioning that the TD Sequential indicator’s buy signal may be invalidated. Besides, the declining volume could slow down the uptrend. If the resistance at $10 is not broken, a reversal might come into the picture, sending Chainlink to the major support between $8.7 and $8.9.
Author

John Isige
FXStreet
John Isige is a seasoned cryptocurrency journalist and markets analyst committed to delivering high-quality, actionable insights tailored to traders, investors, and crypto enthusiasts. He enjoys deep dives into emerging Web3 tren


