Chainlink Price Prediction: LINK poised for a 38% downswing amid intensifying overhead pressure
- Chainlink bulls buttered by increasing overhead pressure hence the pessimistic outlook.
- A rising wedge pattern brings to light a possible breakdown to $15.
- The IOMAP reveals that LINK is sitting on areas with immense support, which could invalidate the breakdown.
-637336005550289133_XtraLarge.jpg)
Chainlink has recently been rejected from its newly achieved all-time high, a move that has delayed the expected uplift to $30. Recovery is an uphill battle as bears increase their dominance in the market. For now, the least resistance path is downwards; thus, the question is how far the retracement will go?
Chainlink launches oracle networks beyond crypto price feeds
Chainlink can be referred to as the glue that sticks decentralized finance (DeFi) projects together. The protocol provides live price feed data to smart contracts within the DeFi sector. According to an announcement made via Twitter, Chainlink is keen on supporting new products within the ecosystem beyond crypto price feed.
At the moment, Chainlink oracles can be leveraged to acquire “EUR and GBP FX rates, gold and silver commodity prices, Nikkei 225 indices and blockchain data.”
Chainlink massive breakdown imminent
LINK is exchanging hands at $24.5 amid increasing selling pressure. Additionally, a rising wedge pattern on the 4-hour chart hints at a potential 38% breakdown to $15. The technical analysis finds this pattern bearish and suggests that a breakdown is imminent before Chainlink resumes the uptrend to a new record high.
The pessimistic outlook has been reinforced by the Moving Average Convergence Divergence (MACD). The MACD line (blue) is persistent in increasing the divergence below the signal line.
In other words, sellers are gaining more influence while bulls struggle to stay afloat. Notably, in some support areas at $20, the 50 Simple Moving Average and the 200 SMA will come in handy, absorbing the selling pressure.
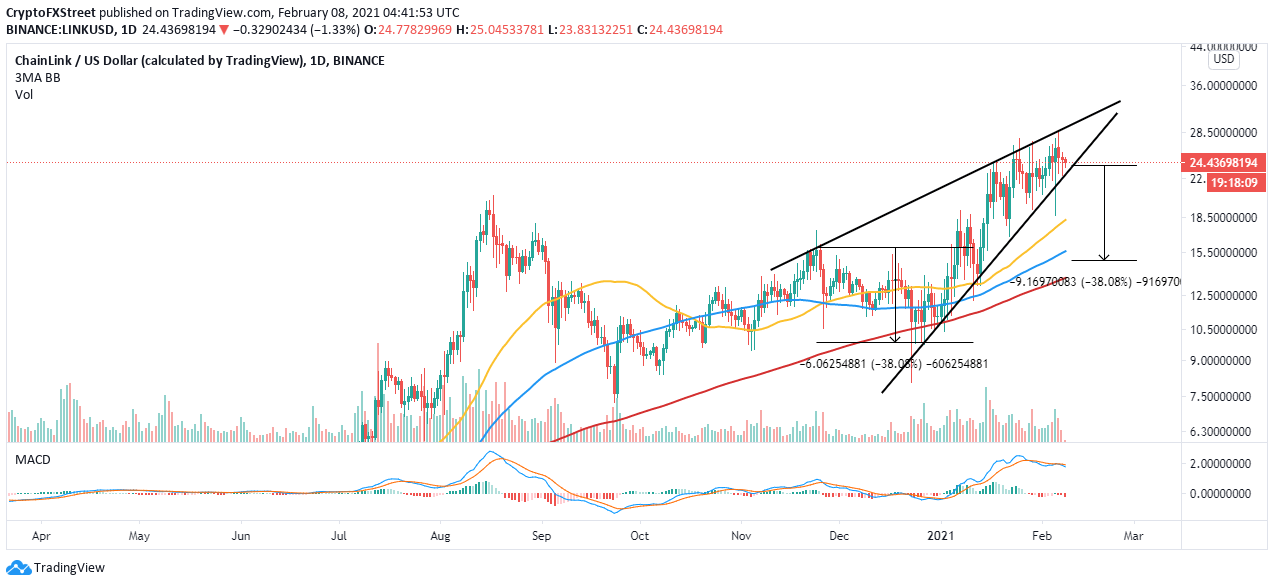
LINK/USD 4-hour chart
The TD Sequential indicator recently presented a sell signal on the 12-hour chart. A green nine candlestick illustrated the call to sell. Chainlink is likely to fall in one to four 4-hour candlesticks before recovery comes into the picture. The rising wedge could accentuate the magnitude of the breakdown.
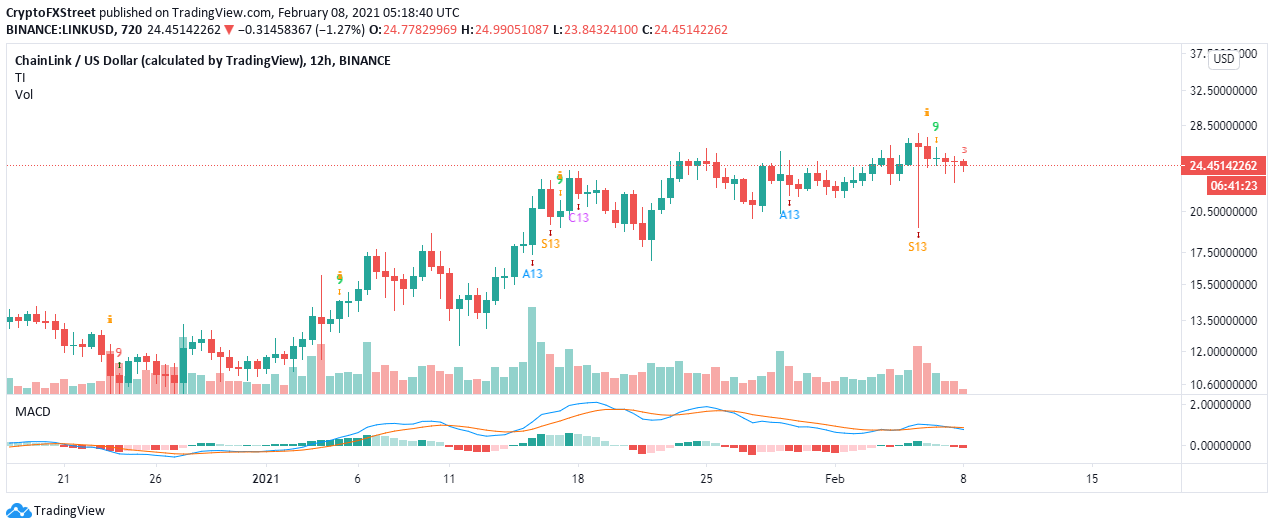
LINK/USD 12-hour chart
Looking at the other side of the fence
The IOMAP model, developed by IntoTheBlock, shows that Chainlink is sitting on areas of immense support. These robust on-chain support zones may invalidate the technical breakdown explored above. In other words, if even if LINK fails to rise to new all-time highs, consolidation will take precedence, in turn, averting the losses.
-637483583673233671.png)
Chainlink IOMAP
On the upside, the model highlights some resistance levels ahead of LINK. However, they are not as intense as the buyer congestion zones. Therefore, an increase in buying pressure may well catapult Ethereum above $25 and restart the journey toward $30.
Author

John Isige
FXStreet
John Isige is a seasoned cryptocurrency journalist and markets analyst committed to delivering high-quality, actionable insights tailored to traders, investors, and crypto enthusiasts. He enjoys deep dives into emerging Web3 tren


