Chainlink Price Forecast: LINK experiences repeated rejections at key price levels
- LINK's price has struggled to cross over the 50-day and 100-day SMAs.
- The whales are looking to dump their holdings, which is a worrying sign.
-637336005550289133.jpg)
LINK reached an all-time high of $19.35 on August 16 but then started a downward trend, reaching $7.65 on September 23. Since then, the decentralized oracle has reached around $10.85. The price has faced repeated rejections at the 100-day SMA ($11.25) and 50-day SMA ($10.80). The 50-day SMA has been particularly strong and has thwarted the price repeatedly.
LINK/USD daily chart
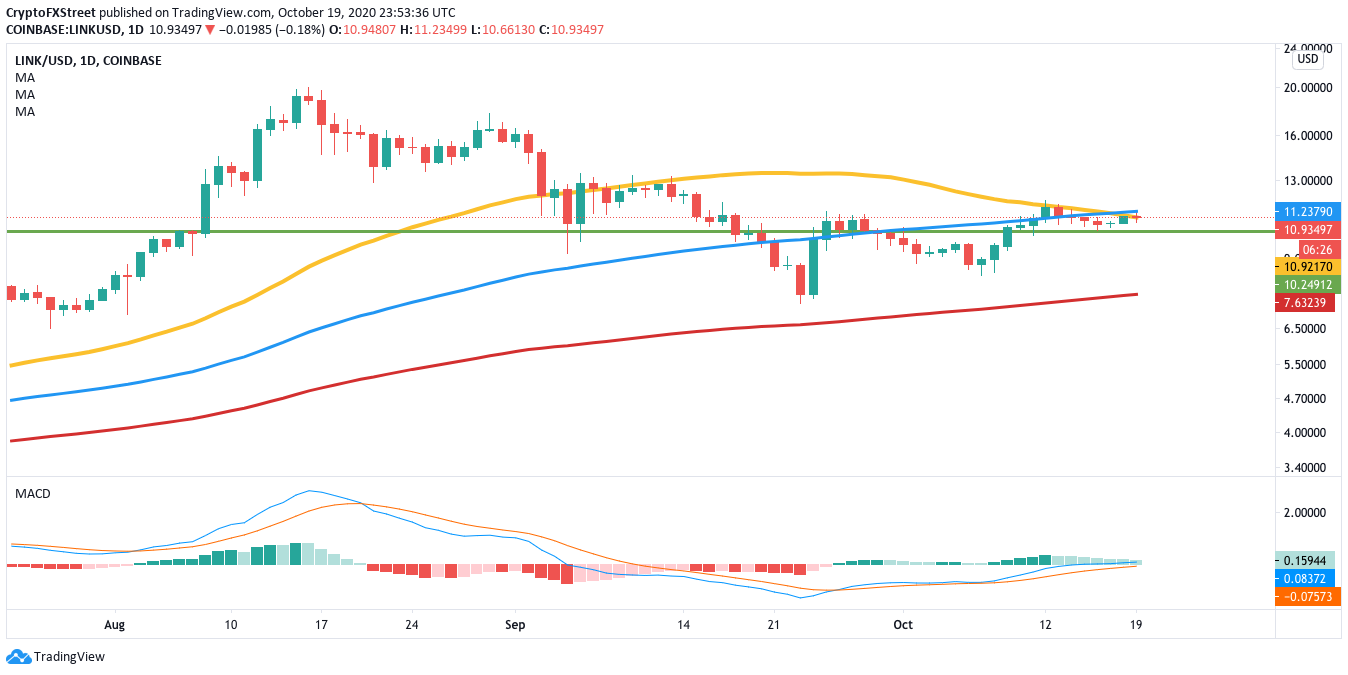
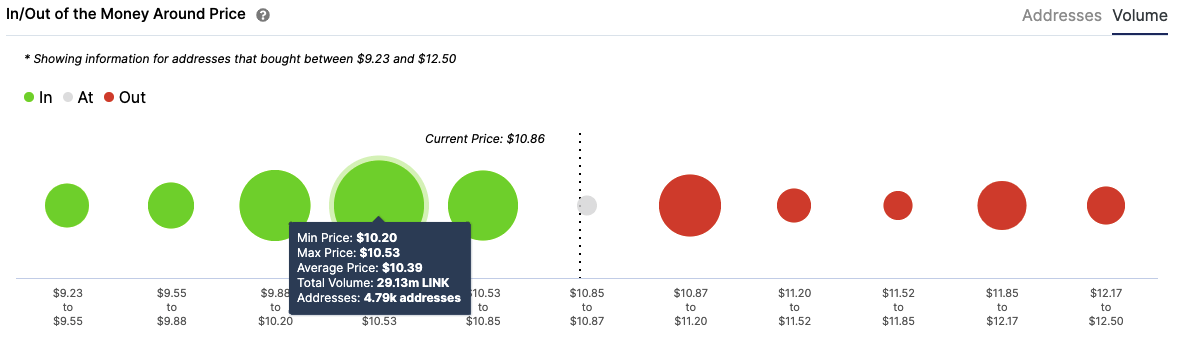
The MACD shows decreasing bullish momentum due to the bearish price action. IntoTheBlock’s In/Out of the Money Around Price (IOMAP) shows that the downside is limited at the $10.25 support wall wherein 4,800 addresses had previously purchased 29 million LINK tokens. A break below this level will take LINK down to the 200-day SMA ($7.65).
LINK IOMAP
Another worrying sign for LINK is the way the whales have been behaving. As per Santiment, the top 100 non-exchange holders' total amount reached a high of 771.3 million LINK on October 7, in a three-month trailing average. Since then, it has dropped to 769.35 million LINK on October 18. If the whales are dumping their holdings, then this is a worrying sign.
Top 100 non-exchange holders
 [05.25.24, 20 Oct, 2020]-637387529215448189.png)
The flipside: Can the bulls change the narrative?
The critical thing for the buyers right now is to flip the 50-day and 100-day SMAs from resistance to support walls. As per the IOMAP, if LINK manages to break past this level, the price will reach $12. The next significant resistance in the daily chart lies at $14.
Key price levels to watch
If the bears take full control following the repeated rejections, the price will drop to the $10.25 support barrier. A break below this support stretch could take LINK down to the 200-day SMA ($7.65).
On the other hand, the bulls will need to flip the 100-day SMA ($11.25) and 50-day SMA ($10.80) from resistance to support. Following that, the price will be able to reach $12.
Author

Rajarshi Mitra
Independent Analyst
Rajarshi entered the blockchain space in 2016. He is a blockchain researcher who has worked for Blockgeeks and has done research work for several ICOs. He gets regularly invited to give talks on the blockchain technology and cryptocurrencies.



![Zcash breaks above 2018 highs, eyes 1600–2500 [Video]](https://editorial.fxsstatic.com/images/i/crypto-coins-1.png)