Band Protocol Technical Analysis: BAND impressive recovery eyes $7.5
- Band Protocol holds above the 200 SMA support while dealing with the short term 50 SMA hurdle.
- On-chain analysis reveals the absence of resistance towards $7.5, adding credence to the bullish outlook.

Band Protocol is crowing the weekend with a remarkable recovery. Following losses from $7.5, support was embraced at $5.8. Over the last few days, the progress made can be attributed to the support Band Protocol is receiving after a successful mainnet launch. At the time of writing, the token is trading at $6.4 amid a fast building bullish momentum.
Band Protocol new mainnet supports customizable data oracles
It is barely a week since Band Protocol had a successful mainnet launch. The upgrade from Wenchang to GuanYu has brought forth several features. For instance, GuanYu allows validators to fulfill data requests in return for a portion of the fee from our partners and developers that have integrated Band Protocol."
The most vital feature of the upgrade is support for "permissionless creation of customizable data scripts that can query public and permissionless data sources." The scripts also leverage decentralized networks from more than 67 validator nodes.
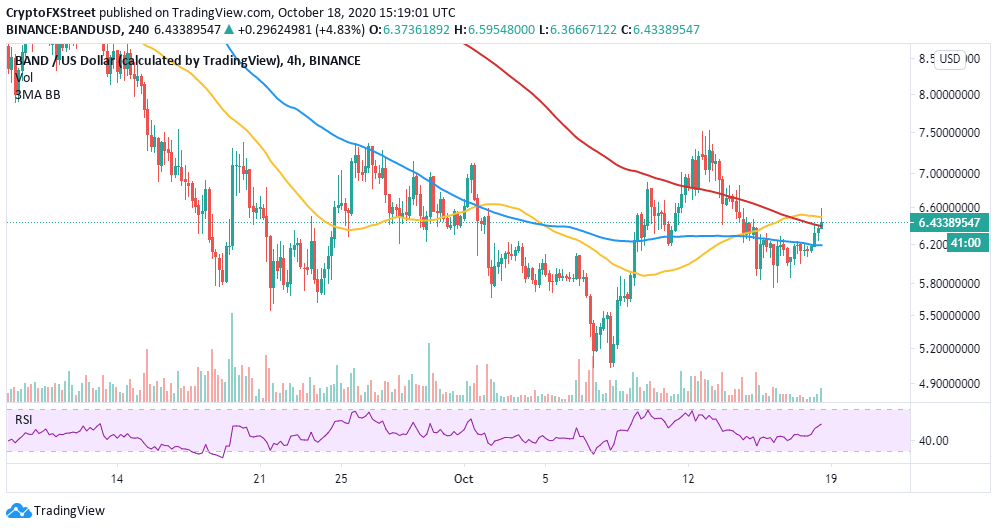
Band Protocol bulls regain control of the trend
Marginally above $6.4, BAND is dealing with seller congestion highlighted by the 50 Simple Moving Average (SMA) in the 4-hour timeframe. The 200 SMA supports the immediate downside.
Consequently, the bullish outlook is emphasized by the Relative Strength Index (RSI) as it grinds to the overbought area. Trading above the 50 SMA would boost BAND towards the crucial resistance at $7.50
BAND/USD 4-hour chart
IntoTheBlock's IOMAP model suggests that the path to $7.5 is relatively smooth due to the lack of strong resistance. However, bulls must prepare to slice through the subtle supply at $6.5 - $6.7. Here, 646 addresses previously brought approximately 271,000 BAND. On the downside, immense support exists between $6.1 and $6.3. Earlier, 369 addresses almost 3.5 million BAND. It is unlikely that bears will penetrate this zone and push BAND to $5.
Band Protocol IOMAP chart
-637386332230970771.png)
Looking at the other side of the fence
It is worth mentioning that the bullish outlook would be invalidated if the 50 SMA resistance remains intact. Moreover, the immediate support at the 200 SMA does not seem strong enough to hold BAND if a reversal comes to the picture. The most formidable support lies at $6.2 and last week's anchor at $5.8.
Author

John Isige
FXStreet
John Isige is a seasoned cryptocurrency journalist and markets analyst committed to delivering high-quality, actionable insights tailored to traders, investors, and crypto enthusiasts. He enjoys deep dives into emerging Web3 tren


