Chainlink Price Forecast: LINK could rocket 37% if this technical pattern confirms
- Chainlink is on the verge of a massive technical breakout eyeing new all-time highs of $43.5.
- An ascending triangle has a bullish impulse with a precise breakout target.
- A massive influx in whale transactions suggests that investor risk appetite is rising again.
- The upswing to $43.5 may fail to occur if the triangle’s x-axis resistance fails to give way.
-637336005550289133.jpg)
Chainlink has made a considerable recovery from the downswing in February. The drop from the all-time high of $37 managed to secure and embrace support at $20. A rebound came into the picture and has been persistent despite the resistance at $31. If LINK breaks above this crucial resistance, a massive breakout will occur above the record highs.
Chainlink whales increase activity
According to Santiment’s Whale Transactions Count model, large volume holders recently moved colossal amounts of LINK. For instance, roughly 1,400 transactions, each worth over $100,000, were completed on March 8. This marked the second-largest whale transaction day in the history of Chainlink.
%20[08.44.47,%2009%20Mar,%202021]-637508677610415580.png)
Chainlink whale transactions
Chainlink awaits gigantic technical breakout
The decentralized live price feed Oracle token is on the edge of a massive technical breakout, following an ascending triangle pattern. It is a bullish continuation pattern that results in a definite breakout target.
An ascending triangle is created by two trendlines where one connects the relatively equal peaks (x-axis) and the other links the consecutive increasing lows. A breakout is expected to occur before the lines converge.
These triangles signify a consolidation period, characterized by a low trading volume ahead of the breakout. An upswing is anticipated on slicing through the x-axis; for Chainlink, the technical breakout eyes are $43.5.
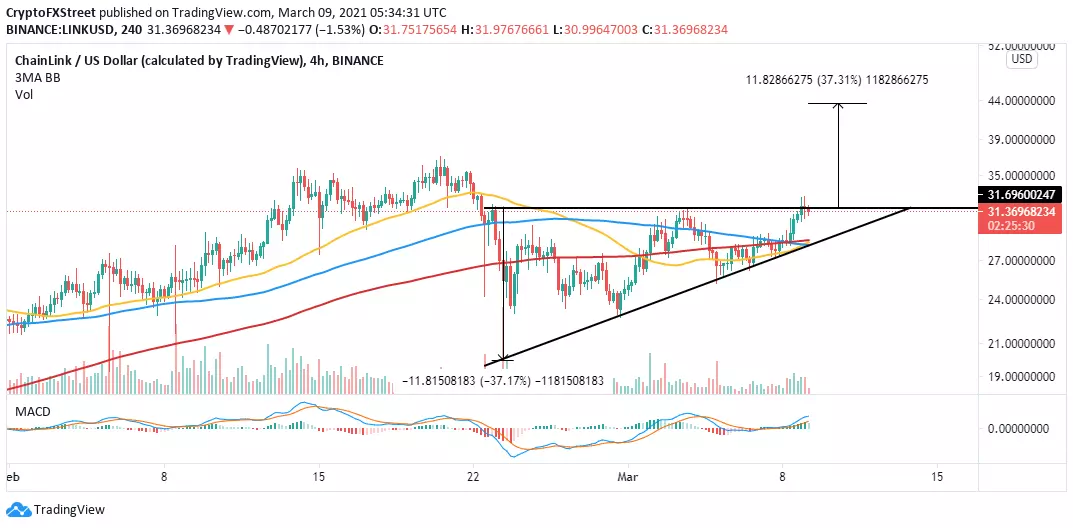
LINK/USD 4-hour chart
Looking at the other side of the picture
If Chainlink fails to break above the x-axis of the ascending triangle in the near term, selling pressure is bound to increase appreciably. Besides, the Moving Average Convergence Divergence (MACD) shows signs of stalling. On the downside, support is expected at the 200 Simple Moving Average (SMA), around $28. If push comes to shove, LINK will dive massively under the hypotenuse.
Author

John Isige
FXStreet
John Isige is a seasoned cryptocurrency journalist and markets analyst committed to delivering high-quality, actionable insights tailored to traders, investors, and crypto enthusiasts. He enjoys deep dives into emerging Web3 tren


