Chainlink price action slips while markets continue their rally
- Chainlink price action rallies 8% in the past two trading days.
- LINK price slips, however, as important technical indicators point to its rally ending.
- Expect to see a return to $7 and a ‘flip-a-coin’ moment for whether the rally can be restarted.
-637336005550289133.jpg)
Chainlink (LINK) price action takes a huge step back this Tuesday morning as it tanks over 2% while other asset classes and cryptocurrency peers are rallying. The retrenchment was already heralded by a technical indicator suggesting bulls might be muted with downside to follow. Expect to see another leg lower to test a trend line, and should LINK price fall below there, more losses towards $6.50.
LINK price set to turn a positive week into a negative one
Chainlink price action tanks over 2% this Tuesday morning while all equity indices are making gains. The fact that Chainlink is deviating a little bit is not a big problem, as the 55-day Simple Moving Average is putting sticks in the wheels of its rally. The fade is nearly paring back all the incurred gains from Monday and could forecast another loss for this week.
LINK price could be acting as a canary in the coal mine alerting traders to a general disquiet. The real stress test will come at the red descending trend line marked on the chart below. If price action drops below the trend line, bears will have two clear indicators that more downside is to come, and they will, in increasing numbers, want to be part of this sell-off. On a break below the red descending trend line, expect a nosedive move toward $6.50 and from there price flirting with the low of October at $6.33.
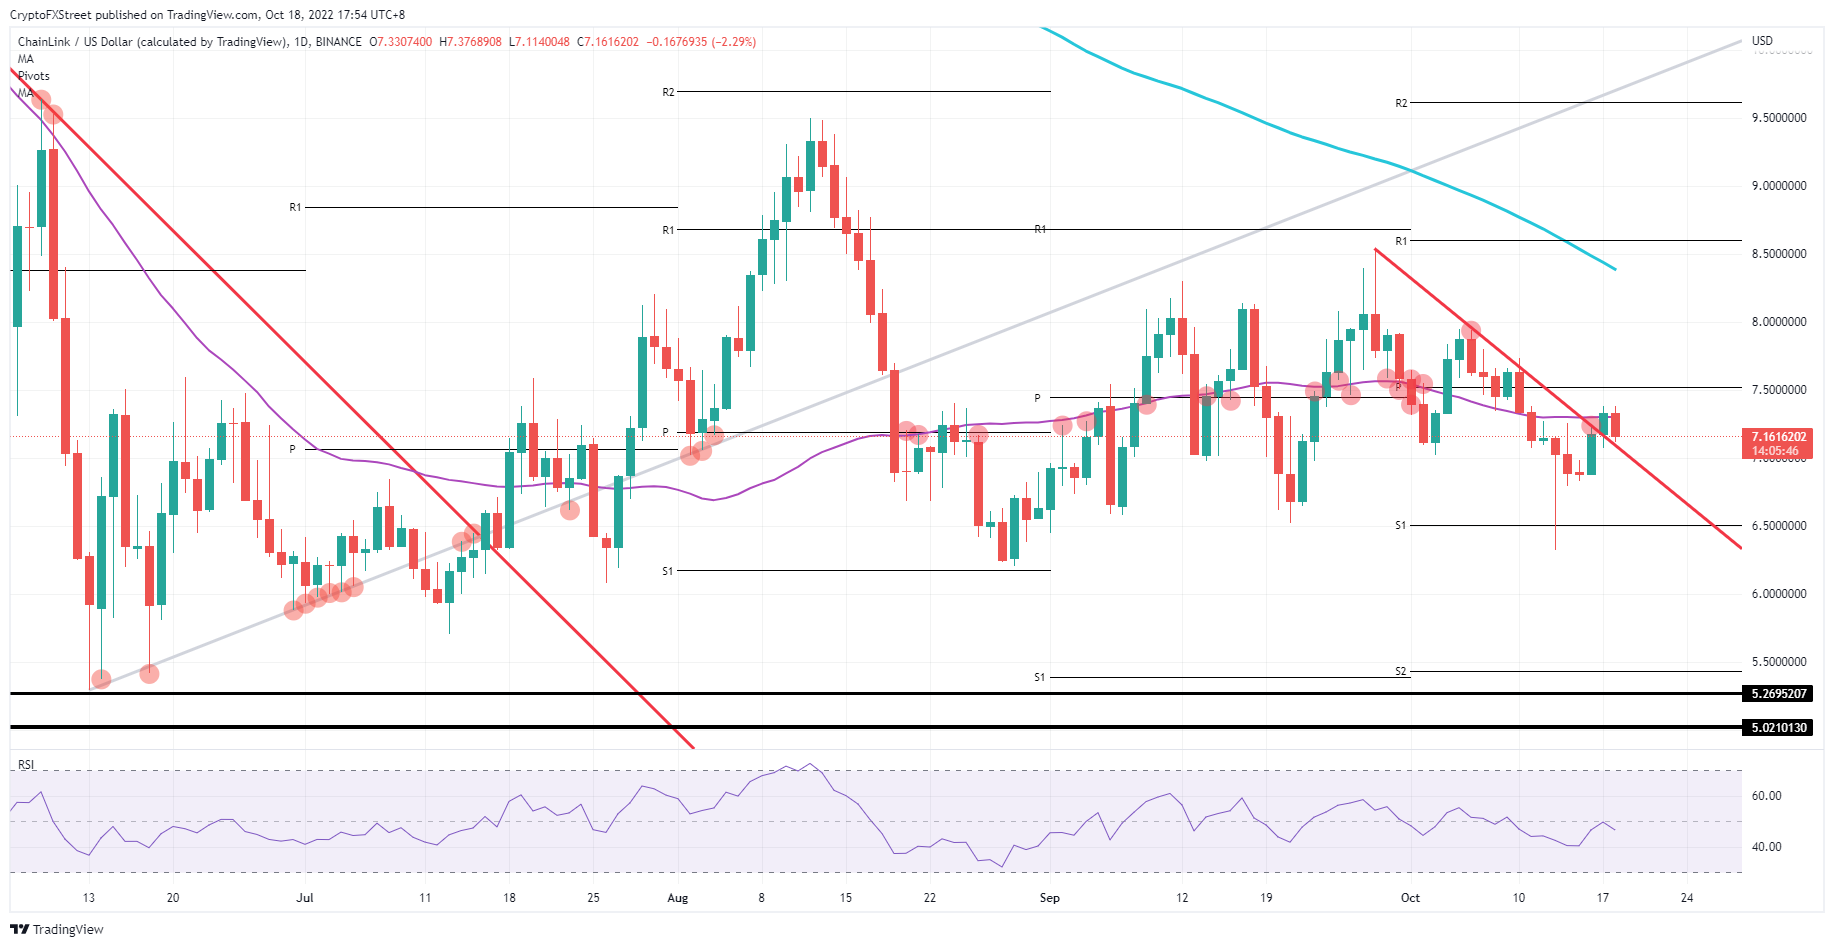
LINK/USD Daily chart
Alternatively, in a more bullish scenario, should the LINK price be able to bounce off and close above the red descending trend line before the end of the trading day, bulls will get the chance to buy in again and ramp price action up. This will likely mean that the high of today at $7.37 will be broken to the upside and price may reach $7.50. After that is the 200-day SMA at $8.50 if the rally continues towards the weekend. If equity earnings throughout the week surprise to the upside, more gains could also be up for grabs.
Author

Filip Lagaart
FXStreet
Filip Lagaart is a former sales/trader with over 15 years of financial markets expertise under its belt.


