Chainlink Elliott Wave technical analysis [Video]
![Chainlink Elliott Wave technical analysis [Video]](https://editorial.fxsstatic.com/images/i/CHAINLINK_XtraLarge.png)
Elliott Wave Analysis TradingLounge.
Link/ U.S. dollar(LINKUSD).
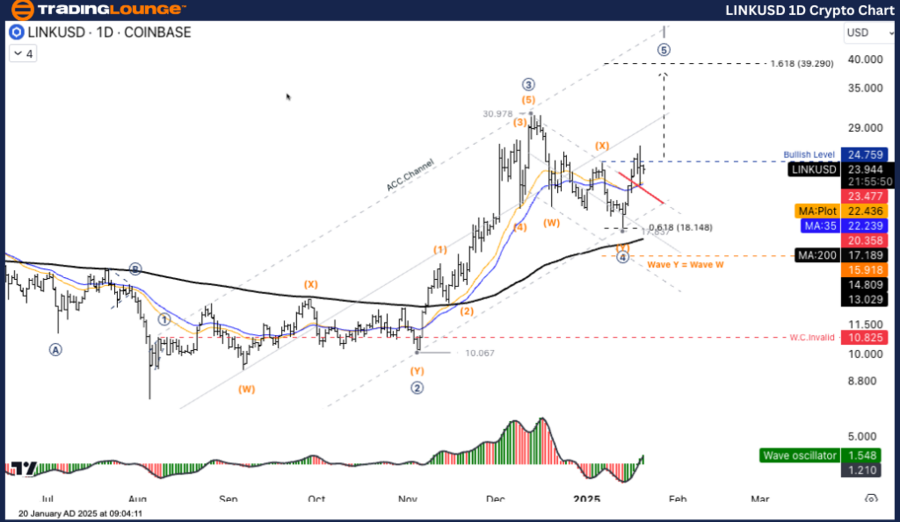
LINK/USD Elliott Wave technical analysis
Function: Follow Trend.
Mode: Motive.
Structure: Impulse.
Position: Wave ((5)).
Direction next higher degrees: Wave I of Impulse.
Details: Price is developing in Wave 5 of a large bullish structure.
Link/ U.S. dollar (LINKUSD) Trading Strategy: Wave (4) ended at 17.837 (61.8% Fibonacci level) with a bounce to Wave (5). Positive Oscillator: Indicates strong uptrend momentum. Wave (5) 1.618 Fibonacci Extension level target is around 39.290.
Main outlook
-
Bullish Scenario: If the price holds above 24.759, it is recommended to target 30.978 or 39.290.
-
Bearish Scenario: If the price breaks below 17.837, it may test the support at 15.918.
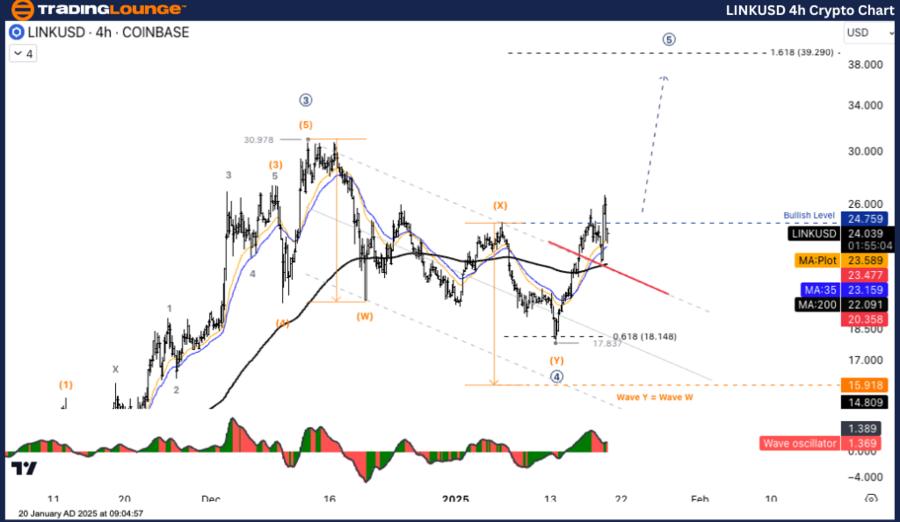
LINK/USD Elliott Wave technical analysis
Function: Follow Trend.
Mode: Motive.
Structure: Impulse.
Position: Wave ((5)).
Direction next higher degrees: Wave I of Impulse.
Details: Price is developing in Wave 5 of a large bullish structure.
Link/ U.S. dollar (LINK/USD) Trading Strategy: Wave (4) ended at 17.837 (61.8% Fibonacci level) with a bounce to Wave (5). Positive Oscillator: Indicates strong uptrend momentum. Wave (5) 1.618 Fibonacci Extension level target is around 39.290.
Main outlook
-
Bullish Scenario: If the price holds above 24.759, it is recommended to target 30.978 or 39.290.
-
Bearish Scenario: If the price breaks below 17.837, it may test the support at 15.918.
Chainlink Elliott Wave technical analysis [Video]
Author

Peter Mathers
TradingLounge
Peter Mathers started actively trading in 1982. He began his career at Hoei and Shoin, a Japanese futures trading company.


