Chainlink Elliott Wave technical analysis [Video]
![Chainlink Elliott Wave technical analysis [Video]](https://editorial.fxstreet.com/images/Markets/Currencies/Cryptocurrencies/Coins/Chainlink/Chainlink_logo (1)-637336005550289133_XtraLarge.jpg)
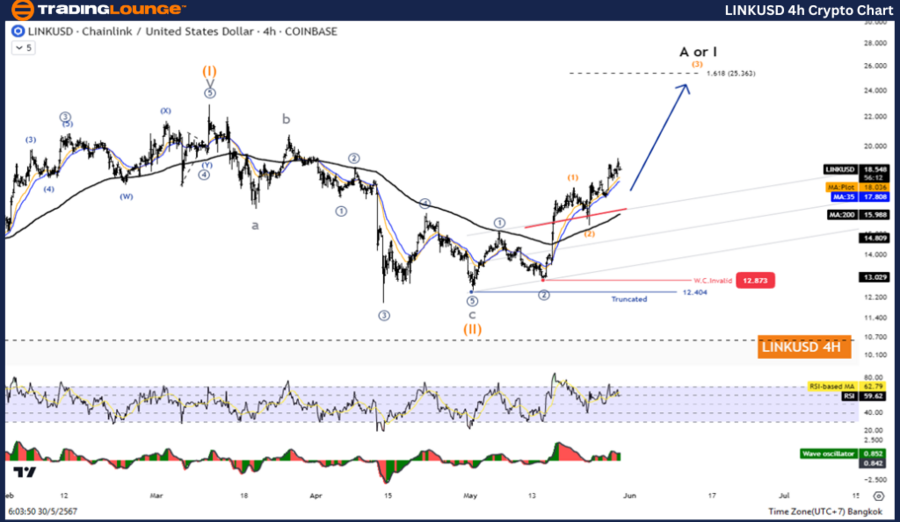
LINK/USD Elliott Wave technical analysis
Function: Counter trend.
Mode: Corrective.
Structure: Zigzag.
Position: Wave C.
Direction next higher degrees: Wave (I) of impulse.
Wave cancel invalid level: 8.498.
Details: Wave C may be complete and the price increase again in wave A or I.
LINK/USD trading strategy
It looks like the correction wave (II) is over. And the price is rising in wave (III), so we will focus on the five-wave increase in the impulse pattern, which is likely to stay above the 24.00 level.
LINK/USD technical indicators
The price is above the MA200 indicating an uptrend, the wave oscillator is a bullish momentum.
.thumb-638526389577318184.png.f89ea661790a3f3aef8c8496e3a0c97c (1)-638526389577318184.png)
LINK/USD Elliott Wave technical analysis
Function: Counter trend.
Mode: Corrective.
Structure: Zigzag.
Position: Wave C.
Direction next higher degrees: Wave (I) of impulse.
Wave cancel invalid level: 8.498.
Details: Wave C may be complete and the price increase again in wave A or I.
LINK/USD trading strategy
It looks like the correction wave (II) is over. And the price is rising in wave (III), so we will focus on the five-wave increase in the Impulse pattern, which is likely to stay above the 24.00 level.
LINK/USD technical indicators
The price is above the MA200 indicating an uptrend, the wave oscillator is a bullish momentum.
LINK/USD Elliott Wave technical analysis [Video]
Author

Peter Mathers
TradingLounge
Peter Mathers started actively trading in 1982. He began his career at Hoei and Shoin, a Japanese futures trading company.


