|

Cardano Price Forecast: ADA flashes sell signal as bears get ready to take control

  • The 100-day SMA limits ADA’s upside.
  • MACD shows that market momentum is about to reverse from bullish to bearish.

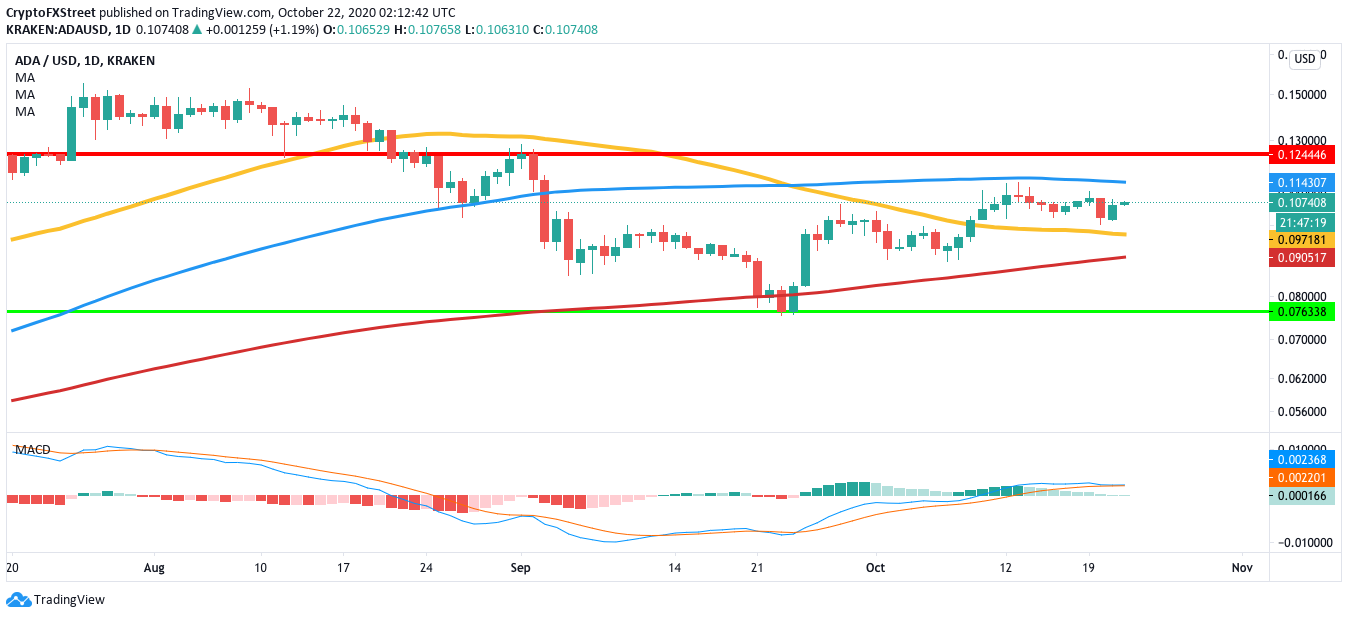
Cardano found support at the $0.076 support line and bounced. As of press time, ADA is trading for $0.107 and is consolidating between 100-day SMA ($0.114) and 50-day SMA ($0.097). The MACD shows that market momentum is on the verge of reversing from bullish to bearish. As such, we can expect ADA in the near future.

ADA/USD daily chart
ADAUSD daily chart

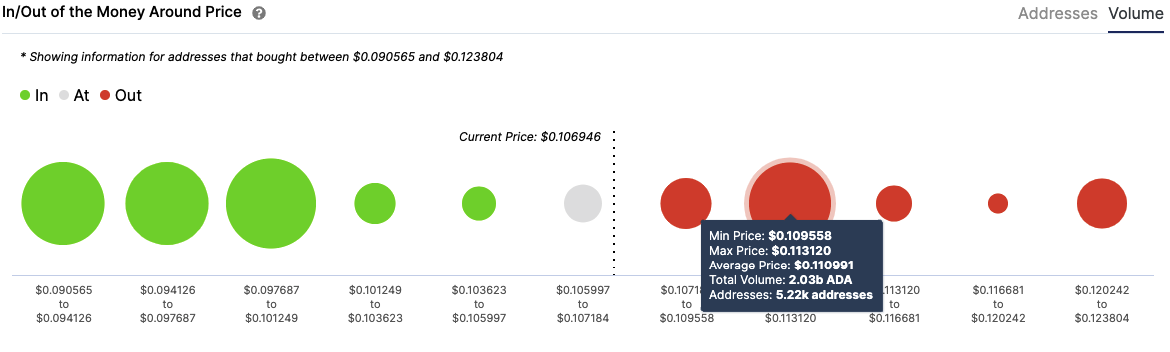
As per IntoTheBlock’s IOMAP, the Ethereum killer has strong resistance at the 100-day SMA. Previously at this level, 5,200 addresses had purchased 2 billion ADA. On the downside, if ADA falls, it will drop till the 50-day SMA. A further break below that will take the price to the 200-day SMA ($0.09). Any break below that could be catastrophic as it will take ADA down to $0.076.

ADA IOMAP
fxsoriginal

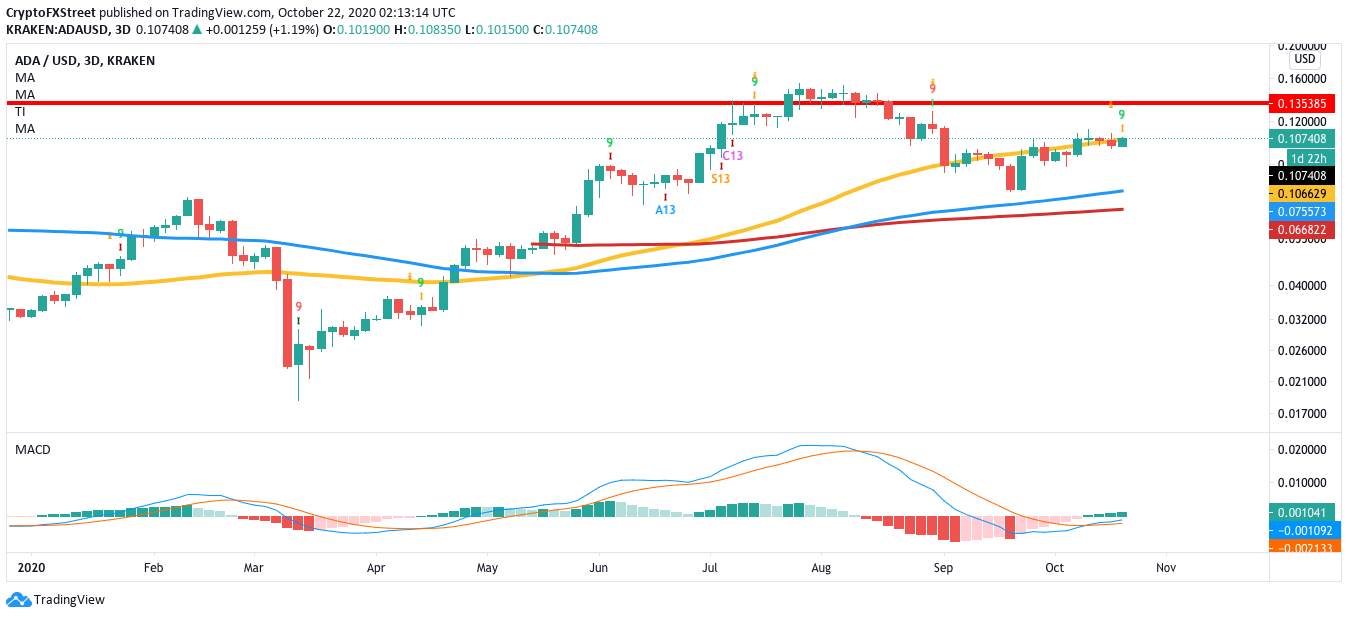
The 3-day chart further corroborates our bearish thesis. After struggling to break above the 50-bar SMA, the TD sequential indicator has flashed the sell signal (green 9). This can trigger a potential drop to the 100-bar SMA ($0.075) and 200-bar SMA ($0.067) 

ADA 3-day chart
adausd 3-day chart

The Flipside: Can the buyers salvage this?

The buyers can turn this narrative by flipping the 100-day SMA ($0.114) from resistance to support. If they break this level, then they should take the price up to the $0.125 barrier. Looking at the weekly chart, the bulls will need to flip the 50-bar SMA ($0.107) to initiate their rally. 

Key price levels to watch

The sellers will be able to assert their dominance by dropping ADA below the 50-day SMA ($0.097), but we can effectively cut off the downside at the 200-day SMA ($0.09).

For the bulls, their main am will be to flip the 100-day SMA ($0.114) from resistance to support. Upon doing that, they should take the price up to $0.125.
 

Author

Rajarshi Mitra

Rajarshi Mitra

Independent Analyst

Rajarshi entered the blockchain space in 2016. He is a blockchain researcher who has worked for Blockgeeks and has done research work for several ICOs. He gets regularly invited to give talks on the blockchain technology and cryptocurrencies.


More from Rajarshi Mitra
Share:

Editor's Picks

XRP approaches key support as risk-off sentiment deepens
Ripple (XRP) is trading at $1.06 on Monday, maintaining its position within a broader bearish trend. The token’s technical outlook continues to deteriorate, pressured by declining retail participation. Appetite for risk assets remains lethargic, as reflected in the Fear & Greed Index, which is embedded in the Fear territory at 28.
Crypto Today: Bitcoin, Ethereum, XRP extend decline amid renewed risk-averse sentiment
The cryptocurrency market remains weak on Monday, with Bitcoin (BTC) falling toward the nearest $62,000. Ethereum (ETH) and Ripple (XRP) reflect the sell-off across altcoins, edging lower toward $1,800 and $1.05, respectively. Risk appetite remains subdued, as the Fear & Greed Index holds steady at 28, deep within Fear territory.
The Bitcoin futures yield collapse: Once over 20%, now less than Treasury notes
Once a goldmine for carry traders, Bitcoin futures have flipped, consistently underperforming plain‑vanilla U.S. Treasuries every month since February. Carry trades consistently yielded 20% or more across regulated and unregulated crypto exchanges during the 2021 bull market. The strategy involved shorting Bitcoin futures while simultaneously buying a spot exchange-traded fund (ETF).
The crypto market is moving in the opposite direction to equities
The crypto market’s market capitalisation has fallen by 1% over the past 24 hours, returning to levels last seen in mid-July. The positive momentum the market showed in the first half of last week failed to take hold. Once again, we are seeing a negative correlation with the Nasdaq 100 index, this time in the form of falling cryptocurrencies while shares rise. Could this be becoming the new norm?
Bitcoin: Bulls hold the line
Bitcoin (BTC) edges slightly lower, trading at $64,300 at the time of writing on Friday but holding firmly above a key support zone. US-listed spot Bitcoin Exchange Traded Funds (ETFs) support BTC as they continued to attract institutional flows through Thursday, pointing to the fourth consecutive week of net inflows.

