Cardano price confronts imposing $1.40, but ADA relative strength may prevail
- Cardano price successfully tests the 200-day SMA with a 46% rebound over three days.
- ADA once again flirting with the 2018 high at $1.40, but it could prove to be a challenge.
- Daily RSI fails to register oversold reading, leaving some doubt that the low is conclusive.

Cardano price rebound from the 200-day simple moving average (SMA) began with a doji candlestick pattern and has since evolved into two meaningful days higher with ADA now testing the intimidating 2018 high of $1.40. ADA may be poised for a period of oscillating price action around $1.40, but the cryptocurrency may have achieved a final corrective low.
Cardano price relative strength shows again in recent sell-off
In the days proceeding the May 23 decline, Cardano price was indecisive and directional intentions were opaque, but the June 21 crash of 17.66% resolved the horizontal pattern and shattered the 2018 high of $1.40. The notable decline of June 21 was followed by another sizeable decline into the 200-day SMA at $0.98 before ADA closed the day with a doji candlestick pattern.
The doji candlestick revealed a high level of indecision, but it also hinted at a potential trend change. The trend change was confirmed on June 23 when Cardano price rallied above the doji high, setting up today’s stand-off between ADA and the 2018 high. It is a battle the altcoin lost in February, March and April of this year.
Daily ADA volume has not been energetic the last two days, suggesting Cardano price may undergo a period of consolidation before unlocking $1.40. However, the ability of the digital asset to avoid printing a new correction low was a departure from the majority of altcoins, establishing a level of relative strength that may accelerate a push higher.
If the rally continues unabated, Cardano price will be engaged by firm resistance at the merger of the anchored VWAP from April 23 at $1.61 with the 50-day SMA at $1.62 and the Ichimoku cloud, delivering a 15% return from $1.40.
A potential short-term scenario for Cardano price is a new trading range between $1.40 and $1.62. Nevertheless, a daily close above $1.40 will be vital in ascertaining the specific intentions of ADA.
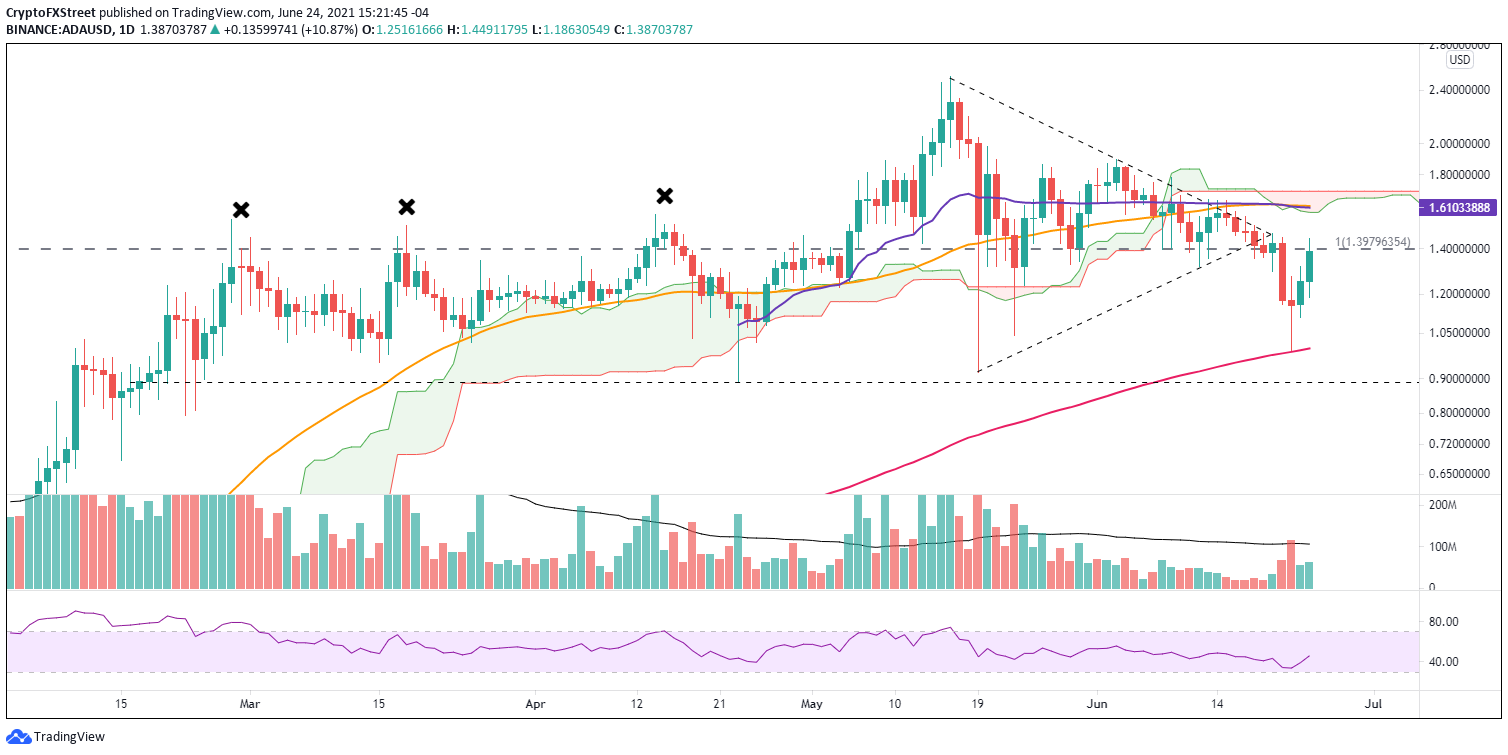
ADA/USD daily chart
Cardano price is not entirely immune from the tribulations of the broader cryptocurrency market. Thus, a new avalanche of selling in digital assets and a strong rebuttal at $1.40 could press ADA to revisit the 200-day SMA and eventually the May 19 low of $0.91.
Cardano price is still vulnerable to reversion, despite the 47% rebound from the June 22 low, particularly when ADA is confronting a strategic price level like the 2018 high. Nevertheless, the green token has again displayed relative strength, elevating it to a different category of altcoin and a potential trading range, as cited above.
Author

Sheldon McIntyre, CMT
Independent Analyst
Sheldon has 24 years of investment experience holding various positions in companies based in the United States and Chile. His core competencies include BRIC and G-10 equity markets, swing and position trading and technical analysis.


