Cardano Price Prediction: ADA looks to climb 16% after recent meltdown
- Cardano price dropped 30% from June 20 to June 22 as the crypto market crashed.
- After forming a bottom at $1.01, ADA appears primed to retest $1.451.
- On-chain metrics point to an arduous climb.

Cardano price swept the swing low formed on May 19 during the recent sell-off, creating a bottom. Although ADA has risen considerably from this local low, more upside seems to be on the table.
However, on-chain metrics indicate that the upswing will not be easy.
Cardano price prepares for mean reversion
Cardano price slid 30% after the recent sell-off, setting up a local low at $1.01. Since hitting this level, ADA has risen nearly 24% to where it currently stands, $1.243. The so-called “Ethereum killer” is set to rise to $1.451, just below the 50% Fibonacci retracement level at $1.481.
However, this upswing will need to slice through the resistance level at $1.327 to hit $1.451. If ADA produces a decisive 4-hour close above $1.481, it will likely tag the supply zone, ranging from $1.525 to $1.624.
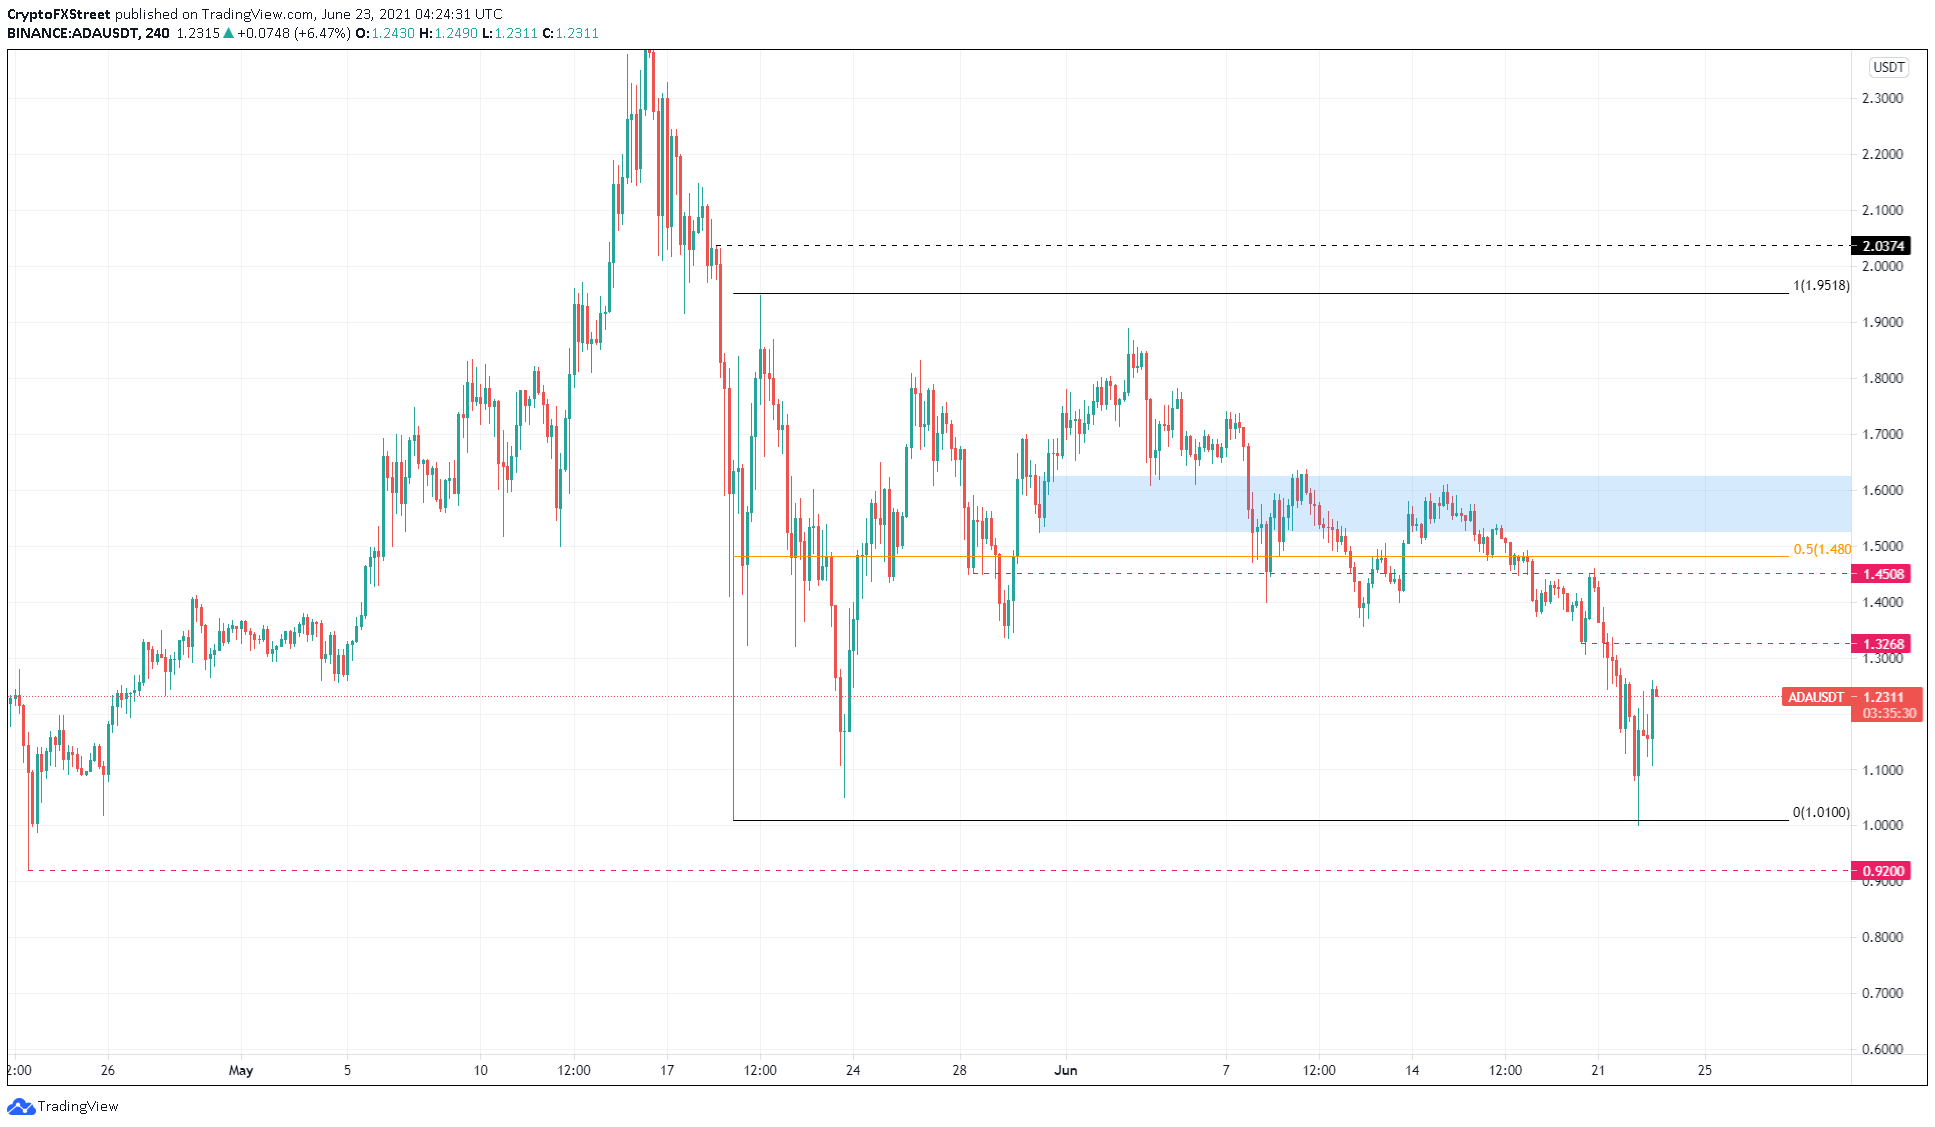
ADA/USDT 4-hour chart
Adding credence to the bull rally is the uptick in new addresses joining the network from 786 to 968 between June 20 to 22. This 23% increase reveals that investors are interested in ADA at the current price.
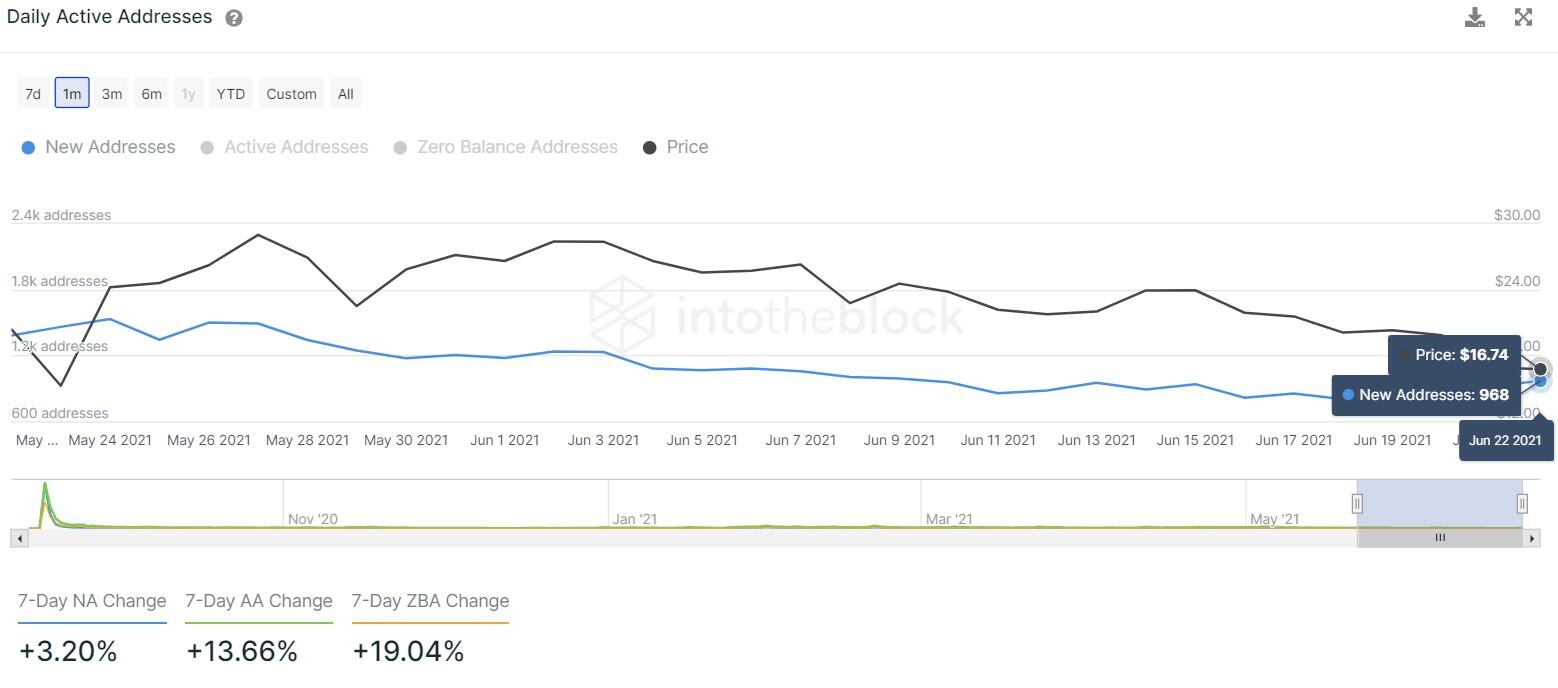
ADA new addresses chart
While ADA price is likely to revert to the mean, IntoTheBlock’s Global In/Out of the Money (GIOM) model shows that the uptrend will be a tough journey.
Roughly 215,000 addresses that purchased 3.91 billion ADA at an average price of $1.33 are “Out of the Money.”
Similar clusters of underwater investors are present up to $1.88. Therefore, the bullish momentum needs to slice through these barriers to have any chance of hitting the intended target.
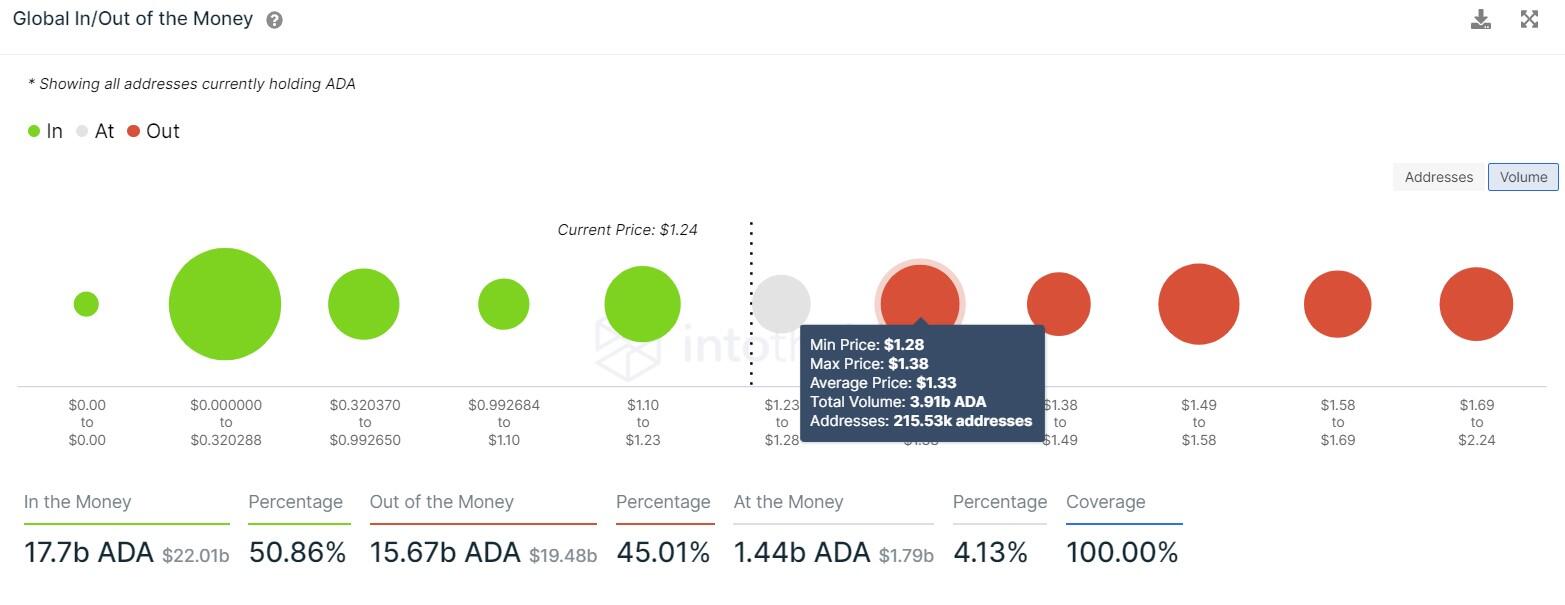
ADA GIOM chart
A sudden spike in selling pressure or rejection at $1.327 could hinder the upswing. Therefore, investors need to keep a close eye on the large transaction metric. This on-chain index tracks transfers worth $100,000 or more and has risen from 2,500 to 4,540 in the past four days.
Often an increase in large transactions coincides with local tops; therefore, the recent bump in this on-chain index indicates that a potential sell-off could be on its way.
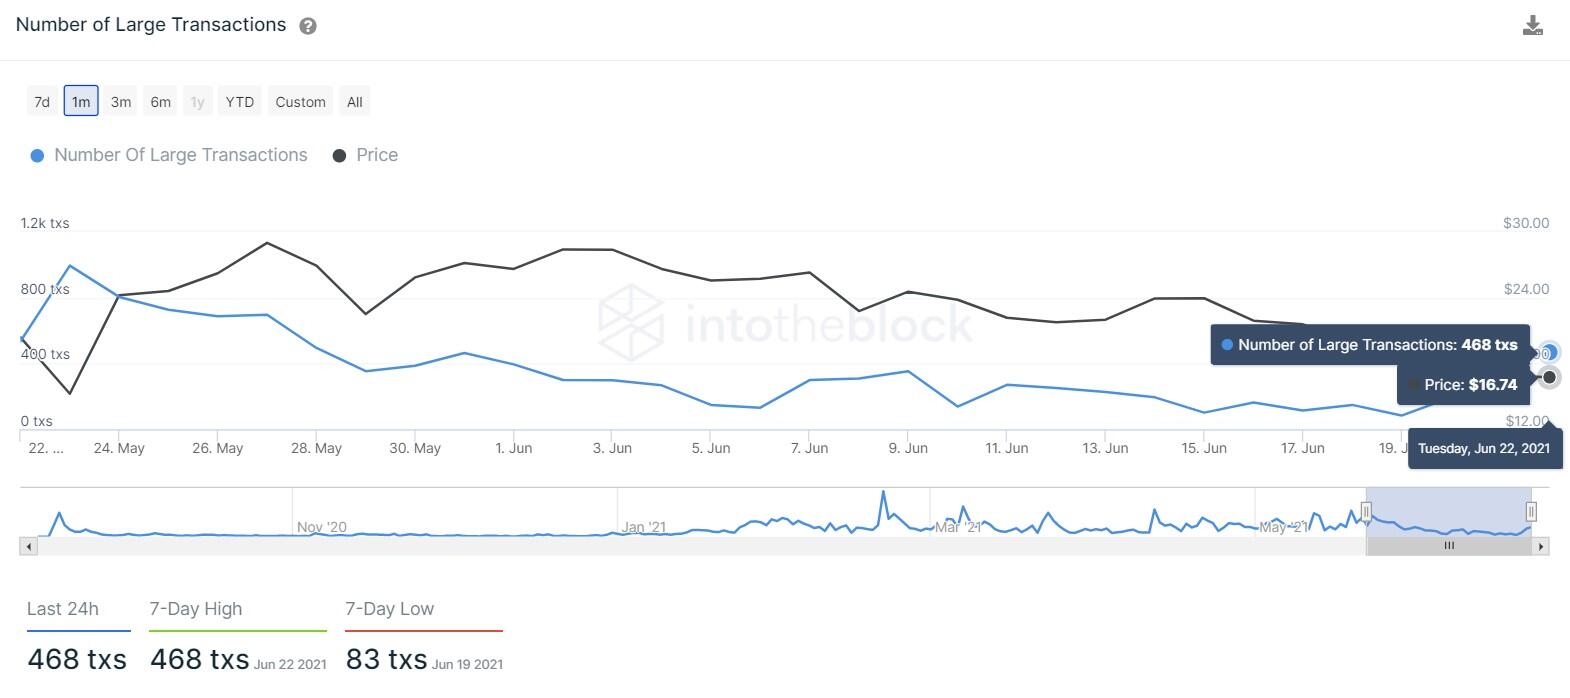
ADA large transaction chart
If Cardano price slices through the recently set up swing low at $1.01, it will invalidate the bullish thesis. In such a case, ADA might retest the local bottom at $0.92 formed on April 23.
Author

Akash Girimath
FXStreet
Akash Girimath is a Mechanical Engineer interested in the chaos of the financial markets. Trying to make sense of this convoluted yet fascinating space, he switched his engineering job to become a crypto reporter and analyst.