|

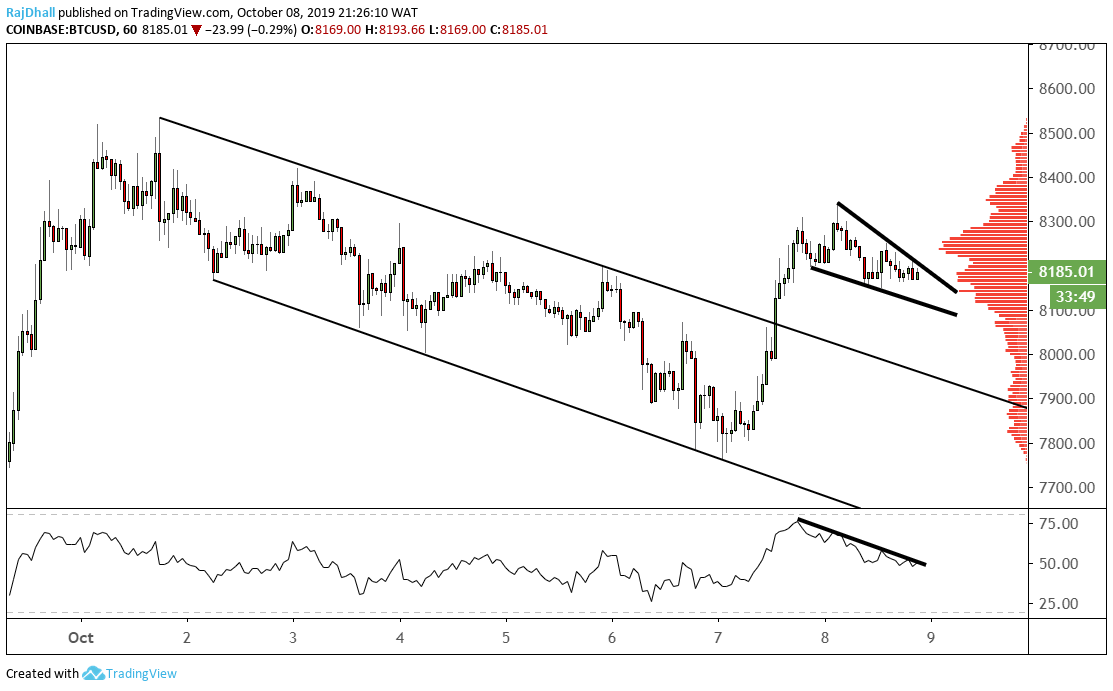
BTC/USD technical analysis: Some important technical patterns are on the hourly chart

  • There is a wedge pattern on the hourly chart that could confirm a bullish directional break.
  • After the channel breakout on the chart, the market has pulled back to retrace near 8,200.

BTC/USD has clearly broken out on the upside from the channel formation.

Now the price has consolidated into a wedge formation and a break higher could be on the cards.

Price is under the main value area which is represented by the volume profile indicator on the right-hand side of the chart.

The relative strength index indicator (RSI) has a trendline at the top and a break above could confirm a bullish move. 

On the downside, a break below the 8k support is the level to keep an eye on but a break of the wedge formation would be first.

Bitcoin Analysis

BTC/USD

Overview
Today last price8156.98
Today Daily Change-54.82
Today Daily Change % -0.67
Today daily open8211.8
 
Trends
Daily SMA20 8769.59
Daily SMA509651.08
Daily SMA10010216.67
Daily SMA2008541.77
 
Levels
Previous Daily High8308.94
Previous Daily Low7768.77
Previous Weekly High8532.46
Previous Weekly Low7706.37
Previous Monthly High10942.68
Previous Monthly Low7706.37
Daily Fibonacci 38.2%8102.6
Daily Fibonacci 61.8%7975.12
Daily Pivot Point S17884.07
Daily Pivot Point S27556.34
Daily Pivot Point S37343.9
Daily Pivot Point R18424.23
Daily Pivot Point R28636.67
Daily Pivot Point R38964.4

Author

Rajan Dhall, MSTA

Rajan Dhall is an experienced market analyst, who has been trading professionally since 2007 managing various funds producing exceptional returns.

More from Rajan Dhall, MSTA
Share:

Editor's Picks

Ripple exposed to volatility amid low retail interest, modest fund inflows

Ripple (XRP) is extending its intraday decline to around $1.40 at the time of writing on Monday amid growing pressure from the retail market and risk-off sentiment that continues to keep investors on the sidelines.

Crypto Today: Bitcoin steadies around $70,000, Ethereum and XRP remain under pressure 

Bitcoin hovers around $70,000, up near 15% from last week's low of $60,000 despite low retail demand. Ethereum delicately holds $2,000 support as weak technicals weigh amid declining futures Open Interest.

Pi Network extends decline as steady mainnet migration adds pressure

PI edges lower by over 3% at press time on Monday, marking a third consecutive day of losses. The declining trend in PI aligns with the steady mainnet migration of PI tokens, which may fuel selling pressure. The technical outlook for PI remains bearish, with bearish momentum persisting. 

Bitcoin slips below $70,000 as ETF outflows, realized losses fuel bearish outlook

Bitcoin price trades in red below $70,000 on Monday after correcting nearly 9% in the previous week. US-listed spot ETFs recorded a $318 million weekly outflow, marking the third consecutive week of withdrawals.

Bitcoin Price Annual Forecast: BTC holds long-term bullish structure heading into 2026

Bitcoin (BTC) is wrapping up 2025 as one of its most eventful years, defined by unprecedented institutional participation, major regulatory developments, and extreme price volatility.

Bitcoin: The worst may be behind us

Bitcoin (BTC) price recovers slightly, trading at $65,000 at the time of writing on Friday, after reaching a low of $60,000 during the early Asian trading session. The Crypto King remained under pressure so far this week, posting three consecutive weeks of losses exceeding 30%.