BTC/USD Technical Analysis: Getting bumped higher, but stepping pattern could gas out
- Bitcoin continues to bump higher in brief moments of bullish momentum.
- Upwards momentum is being driven at odd intervals since bottoming at 5755.0 in June.
- Failure to break above 6850.0, the last major swing high, will see a resurgence of selling interest.

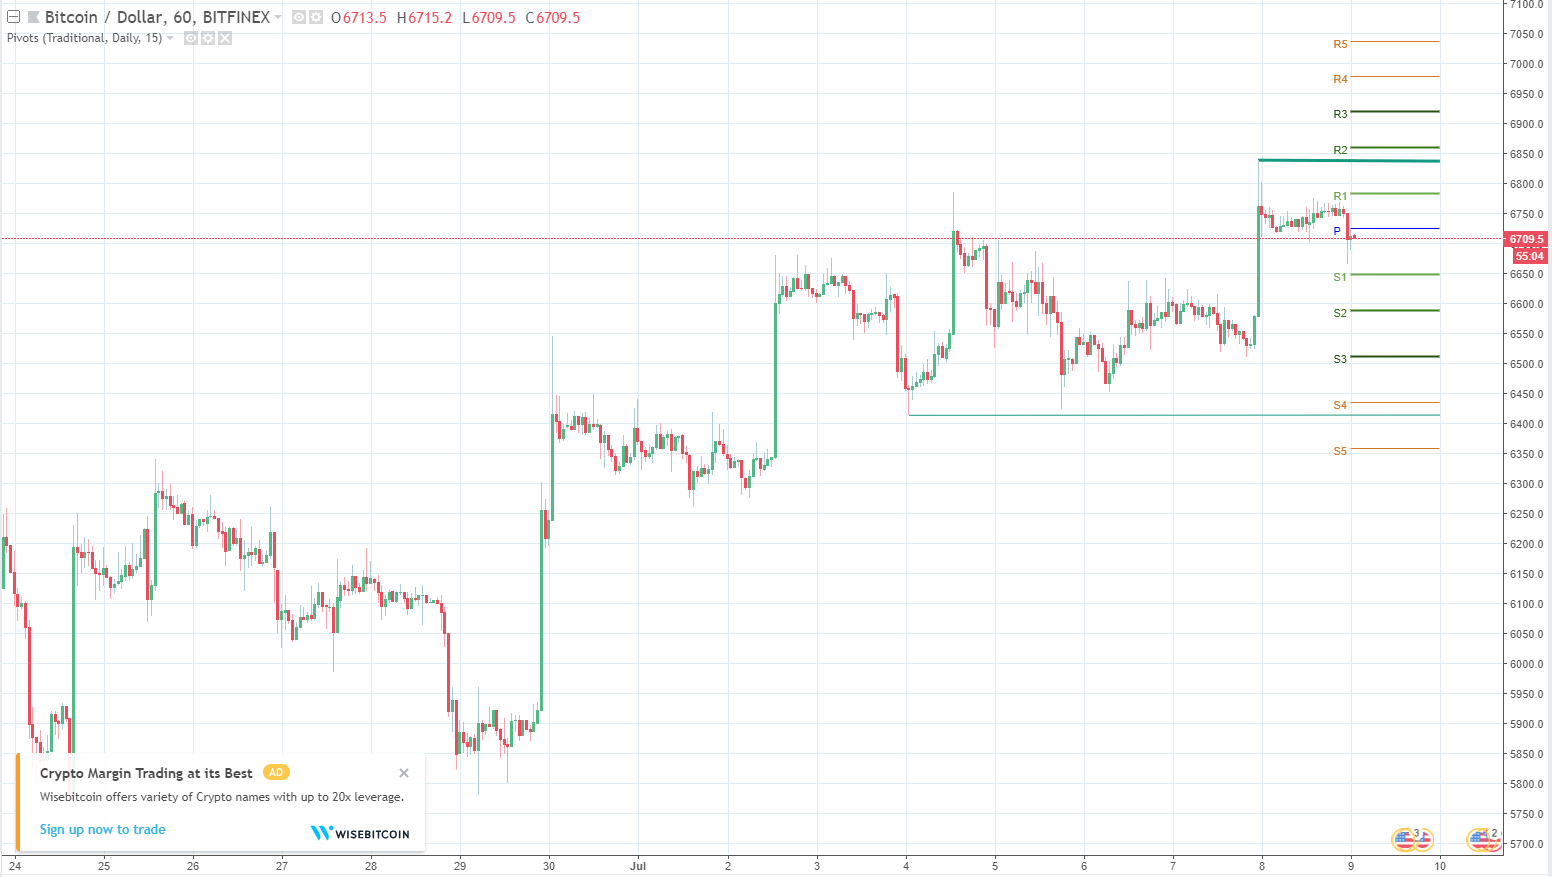
| Spot rate: | 6709.5 |
| Relative change: | 0.03% |
| High: | 6723.7 |
| Low: | 6689.3 |
| Trend: | Bullish |
| Support 1: | 6648.0 (S1 daily pivot) |
| Support 2: | 6510.0 (S2 daily pivot) |
| Support 3: | 6414.0 (previous week low) |
| Resistance 1: | 6785.0 (R1 daily pivot) |
| Resistance 2: | 6839.4 (previous week high) |
| Resistance 3: | 6918.0 (R3 daily pivot) |
Author

Joshua Gibson
FXStreet
Joshua joins the FXStreet team as an Economics and Finance double major from Vancouver Island University with twelve years' experience as an independent trader focusing on technical analysis.
More from Joshua Gibson


