|

BTC/USD Fibonacci analysis: Potential for the further drop

Is BTC/USD poised for a downside continuation?

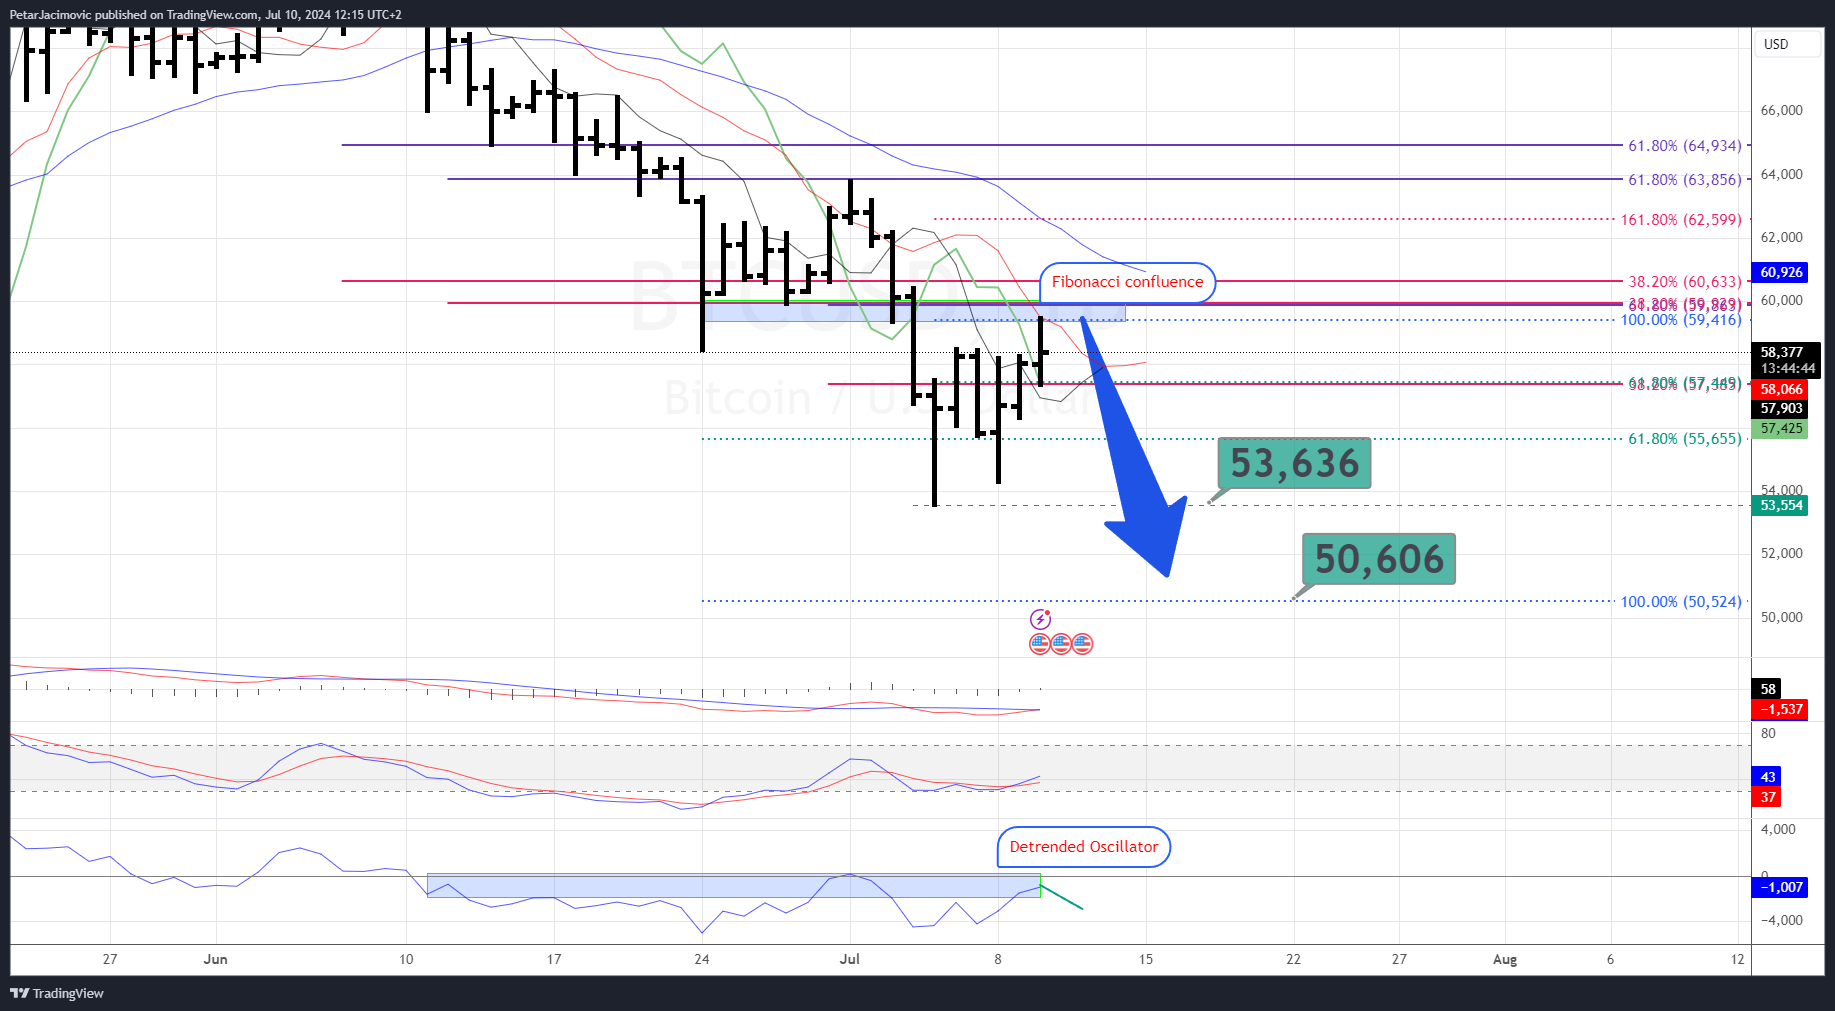
In the daily timeframe, we observed a strong rejection at the key Fibonacci confluence resistance level of $59.500. Detrended oscillator is signaling a potential peak and continuation of the downtrend. The presence of these technical indicators suggests that the price is likely to face increased selling pressure in the near term.
Chart

Utilizing projected Fibonacci expansion targets, we have identified short-term downside objectives at $53.640 and 50.600. These levels are critical as they represent potential areas where the price might find support or experience a temporary pause in the downtrend.

The overall 20-day trend is to the downside, indicating a persistent bearish sentiment in the market. Momentum indicators also support this bearish outlook, reinforcing the likelihood of further declines.

Traders should closely monitor price action around these Fibonacci levels and the behavior of the Stochastic Oscillator. Any significant divergence or convergence at these points could provide early signals for potential reversals or continuations in the trend. Additionally, staying updated with any macroeconomic events or market news that might impact sentiment is crucial for making informed trading decisions.

Author

Petar Jaćimović

Petar Jaćimović was born on 8 July 1989 in Jagodina, Serbia.

More from Petar Jaćimović
Share:

Editor's Picks

Cardano Price Forecast: ADA extends gains after Mastercard deal, Leios testing

Cardano price extends a steady near-term recovery on Monday, inching closer to the long-term 200-day EMA near $0.2464. The recent partnership with Mastercard and the Leios upgrade testing lift ADA investors' spirits. The technical outlook for ADA shows an upside bias as bullish momentum recovers.

Crypto Overview: Bitcoin reclaims $80,000 – Venice Token and NEAR Protocol rally

Bitcoin is trading above $81,000 holding firm after a 6% surge on Friday, linked to US financial watchdogs' efforts to structure crypto assets under existing rules following the CLARITY Act's failure to advance. Venice and NEAR Protocol have posted double-digit gains over the last 24 hours, scaling to fresh annual highs.

Top 3 Price Prediction: BTC extends gains, ETH and XRP advance in uptrend

Bitcoin, Ethereum, and Ripple extend their gains after posting strong gains of over 5%, 6% and 5%, respectively, last week. BTC trades above $81,300, ETH climbs above $2,600, and XRP holds above the key $1.300 support level. All three momentum indicators suggest early bullish momentum and hint at further gains ahead.

Bitcoin pushes above $81K, faces liquidation test between $83K and $86K
Bitcoin (BTC) rose above $81,000 on Friday after climbing back above the True Market Mean, signaling that the market could potentially have moved back into a bullish regime. The True Market Mean, at $76,660, represents the average price paid by active trading participants. BTC’s move back above the level often signals a return to bullish territory and can trigger positive short-term sentiment.
Bitcoin: BTC shrugs off CLARITY Act setback and hawkish Fed
Bitcoin (BTC) price action has remained resilient this week, trading above $78,000 at the time of writing on Friday, heading toward a key resistance zone. Institutional demand shows early signs of weakness, with spot Exchange Traded Funds (ETFs) on track for a second straight week of outflows, with over $420 million recorded through Thursday amid escalating Middle East tensions.



