BTC/USD Elliott Wave technical analysis [Video]
![BTC/USD Elliott Wave technical analysis [Video]](https://editorial.fxsstatic.com/images/i/BTC-bearish-animal_XtraLarge.png)
BTC/USD Elliott Wave technical analysis
-
Function: Follow Trend.
-
Mode: Motive.
-
Structure: Impulse.
-
Position: Wave 1.
-
Wave cancel invalid level: Not specified.

Bitcoin has been in a strong upward wave (1) since it broke above the W–X–Y correction pattern in April. It is now nearing the "sell pressure zone," typically at the Fibonacci 1.618 level seen at the end of impulse waves. After ending the W–X–Y pattern at 74,773.69, the price began a powerful impulse rally forming wave (1). This wave consists of sub-waves 1–2–3–4–5, and the market is now in the last part of wave (1).
Trading strategies
-
For short-term traders (Swing trade)
Monitor the development of wave (2). A rest in wave (2) may offer a major buying opportunity in this bullish market. -
WC invalid
If the price falls below 98,192.13, this would invalidate the current wave count and the structure must be reassessed.
BTC/USD Elliott Wave technical analysis
-
Function: Follow Trend.
-
Mode: Motive.
-
Structure: Impulse.
-
Position: Wave V.
-
Wave cancel invalid level: Not specified
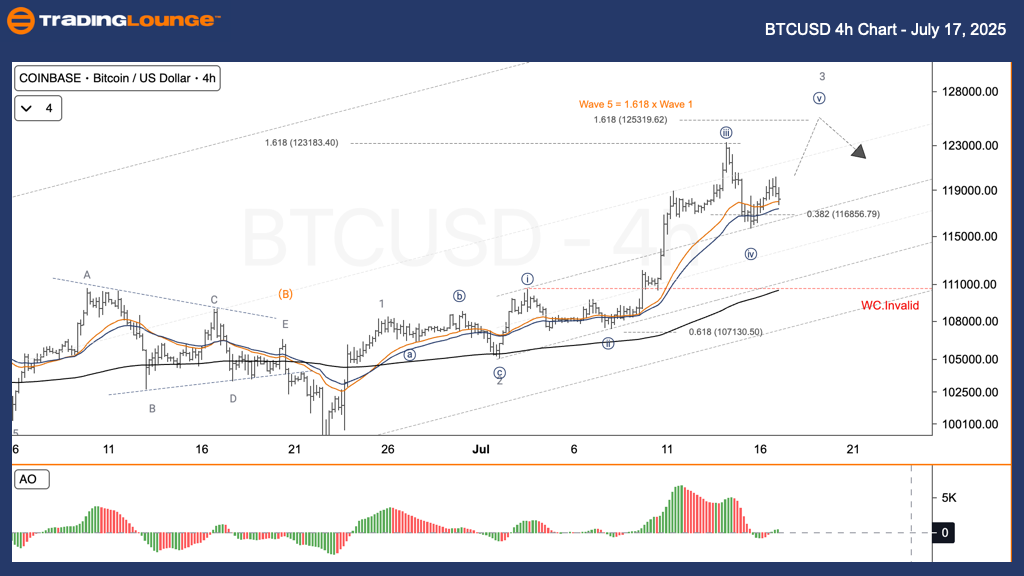
Bitcoin continues in its upward impulse structure. It is currently in wave iv of the larger wave (1), preparing for the final v wave, which is expected to push prices to a new peak. Wave iii has already completed above $122,000. Wave iv has been correcting and is holding near the 0.382 Fibonacci level at 118,656.79.
Trading strategies
-
For short-term traders (Swing trade).
Look for a bounce from the wave iv support area to enter a long trade in wave v. -
W.C. invalid
(Invalidation price not specified for this setup.)
BTC/USD Elliott Wave technical analysis [Video]
Author

Peter Mathers
TradingLounge
Peter Mathers started actively trading in 1982. He began his career at Hoei and Shoin, a Japanese futures trading company.


