BONK reaches fresh all-time high propelled by Upbit listing, hefty token burn
- Bonk price surges to a new all-time high of $0.000062 on Wednesday, following Upbit’s listing of BONK on its exchange.
- The dog-based meme coin announces a 1 trillion tokens burn by Christmas.
- BONK’s open interest hit a record high of $64 million on Wednesday, while the technical outlook projects further gains.

Bonk (BONK) price reaches a new all-time high of $0.000062 on Wednesday after surging more than 100% in the previous week. The main reasons for the rally on Wednesday are BONK’s listing on the Upbit exchange and BONK’s open interest hitting record highs.
Another factor favoring the rally was the announcement on Friday that BONK would burn 1 trillion tokens by Christmas. Additionally, the technical outlook projects more gains toward a new high in the upcoming weeks.
Why is BONK going up today?
Bonk price spikes, rallying nearly 20%, and reaches a new all-time high (ATH) of $0.000062 on Wednesday. The main reasons for the recent price surge are:
First, the listing of BONK on the Korean exchange Upbit on Wednesday. The listing is a positive sign for the token’s accessibility and liquidity. This renewed interest from exchanges will likely attract investors and traders to the dog-based meme coin.
Bonk(BONK) Market Support
— Upbit Korea (@Official_Upbit) November 20, 2024
✅ Supported Market: KRW Market
Trading opens at: 2024-11-20 12:30 KST (estimated time)
Discover more:https://t.co/r2DhwVlJcO#Upbit #BONK pic.twitter.com/Exx09Twd99
Secondly, Coinglass data shows that the futures’ Open Interest (OI) in BONK at exchanges has almost doubled in the last 4 days, rising from $34.05 million on Sunday to $64.11 million on Wednesday, the highest level since its launch. An increasing OI represents new or additional money entering the market and new buying.
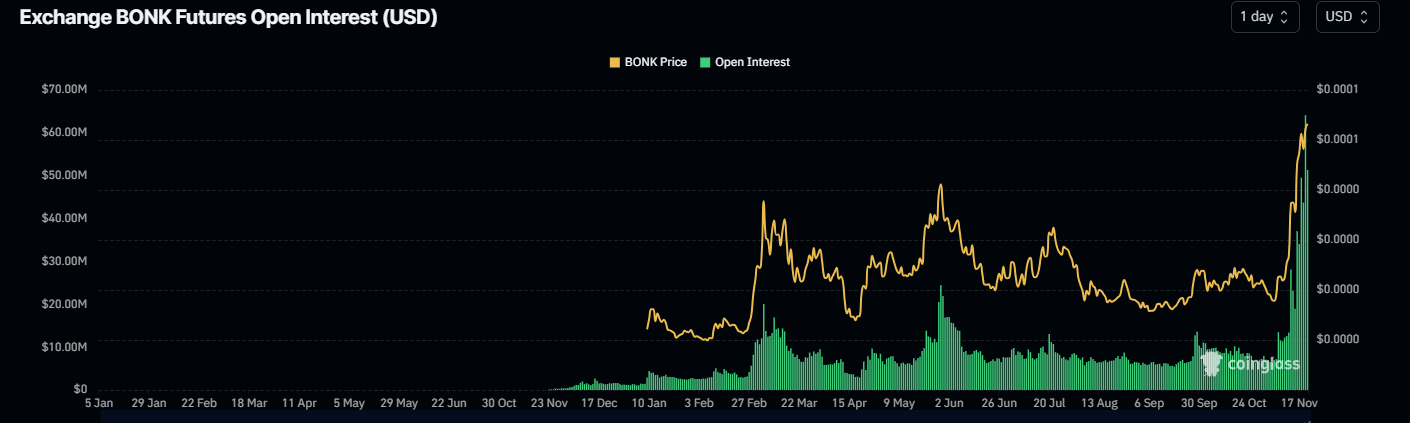
BONK Open Interest chart. Source: Santiment
Lastly, Friday’s announcement of plans to burn 1 trillion BONK tokens before Christmas has also fueled the ongoing rise. The token burn is expected to positively impact its value by reducing supply and increasing its scarcity.
The BONK DAO BURNmas SUPER thread
— BONK!!! (@bonk_inu) November 15, 2024
The Mission: Burn 1 Trillion $BONK by Christmas
The campaign features BONK burns based on specific engagement criteria.
Here's how YOU can help The Dog in what will be the largest on-chain community driven burn event in the history of Solana pic.twitter.com/tcSY5W3vd9
Bonk’s weekly chart shows that its price has reached a new all-time high of $0.000062 on Wednesday after rallying more than 100% in the previous week.
Suppose upward momentum continues and BONK’s price closes above 161.80% Fibonacci extension level (drawn from May’s high of $0.000044 to September’s low of $0.000015) at $0.000062 on a weekly basis. It may set the stage for a potential move towards a fresh all-time high at $0.000070, a significant psychological level.
However, the Relative Strength Index (RSI) momentum indicator on the weekly chart trades at 72, showing overbought conditions and signaling an increasing risk of a correction. Traders should exercise caution when adding to their long positions, as the RSI’s move out of the overbought territory could provide a clear sign of a pullback. Another possibility is that the RSI will remain above the overbought level and continue the upward momentum.
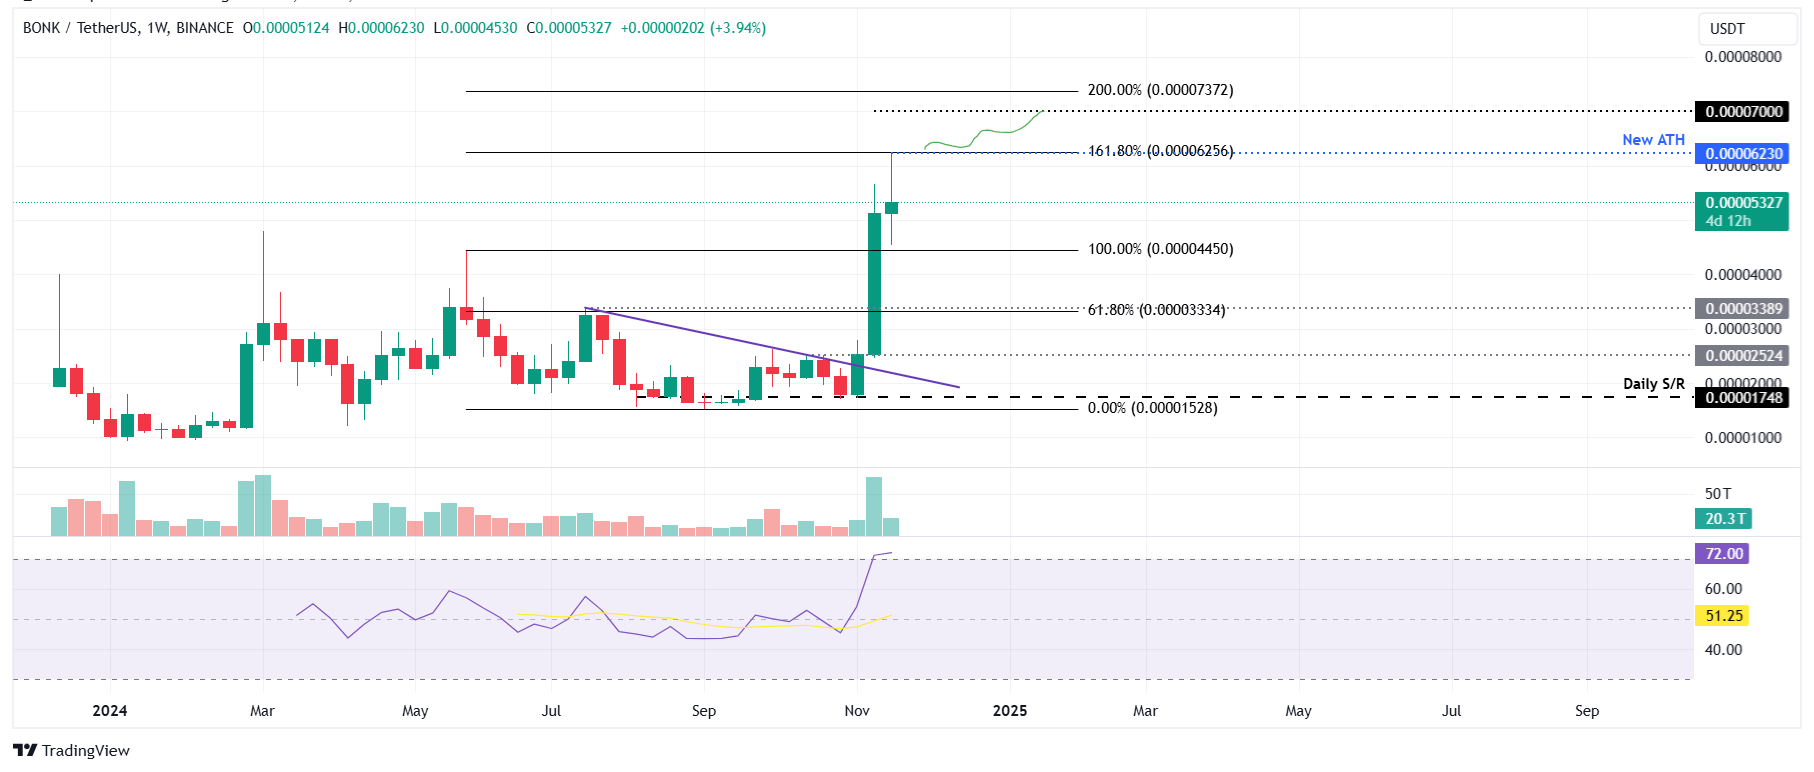
BONK/USDT weekly chart
Author

Manish Chhetri
FXStreet
Manish Chhetri is a crypto specialist with over four years of experience in the cryptocurrency industry.