BNB/USD Elliott Wave technical analysis [Video]
BNB/USD Elliott Wave technical analysis
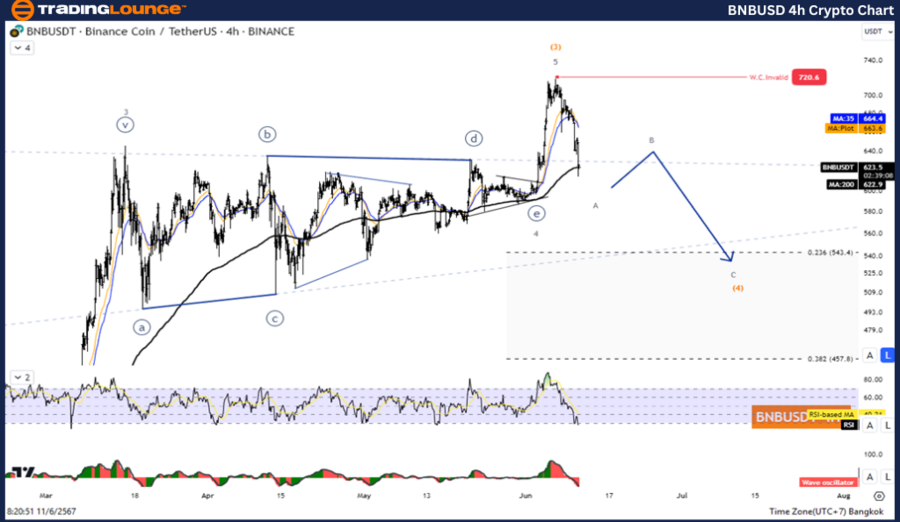
Function: Counter trend.
Mode: Corrective.
Structure: Zigzag.
Position: Wave A.
Direction next higher degrees: Wave (4).
Details: It was corrected in wave 4 before increasing again in wave 5.
BNB/USD trading strategy
It looks like the third wave has ended at the level of 720.6 and the price is entering a correction period in the fourth wave. This was a short-term earthquake before increasing again in the fifth wave. Therefore, the overall picture is still in an upward trend. Look for opportunities from the completion of the correction to rejoin the trend.
BNB/USD technical indicators
The price is below the MA200 indicating an uptrend, the wave oscillator is a bullish momentum.
.thumb-638536778576602951.png.f219a51f16bdc297c82542227373a2af-638536778576602951.png)
BNB/USD Elliott Wave technical analysis
Function: Counter trend.
Mode: Corrective.
Structure: Zigzag.
Position: Wave A.
Direction next higher degrees: Wave (4).
Details: It was corrected in wave 4 before increasing again in wave 5.
BNB/USD trading strategy
It looks like the third wave has ended at the level of 720.6 and the price is entering a correction period in the fourth wave. This was a short-term earthquake before increasing again in the fifth wave. Therefore, the overall picture is still in an upward trend. Look for opportunities from the completion of the correction to rejoin the trend.
BNB/USD technical indicators
The price is below the MA200 indicating an uptrend. The wave oscillator is a bullish momentum.
BNB/USD Elliott Wave technical analysis [Video]
Author

Peter Mathers
TradingLounge
Peter Mathers started actively trading in 1982. He began his career at Hoei and Shoin, a Japanese futures trading company.


