BNB Price Forecast: BNB hits new all-time high at $1,006, bulls eye $1,200 next
- BNB price hovers above $980 on Friday after reaching a new all-time high of $1,006 the previous day.
- On-chain and derivatives data continue to show further gains as TVL and futures open interest reach record highs.
- The technical outlook suggests sustained momentum, with bulls targeting the $1,200 milestone.

BNB (BNB), formerly known as Binance Coin, steadies above $980 at the time of writing on Friday after notching a fresh all-time high (ATH) at $1,006. Strength across on-chain metrics and derivatives markets signals sustained bullish momentum, with BNB traders now eyeing the $1,200 milestone as the next major upside target.
BNB hits a record high following FOMC dovish stance
BNB reached a new all-time high of over $1,000 on Thursday, following the Federal Open Market Committee (FOMC) announcement of a 25-basis-point (bps) interest rate cut late Wednesday, which boosted risk appetite across cryptocurrency markets.
The Fed’s dovish stance, as indicated by the latest dot plot, suggests that interest rates will average 3.6% by the end of 2025, below the June projection of 3.9%. This possibility, along with the potential for additional cuts later this year, has supported risk-on sentiment and a price rally in BNB.
On-chain and derivatives show bullish bias
Artemis Terminal data shows that BNB’s Total Value Locked (TVL) increased to $7.74 billion on Sunday from $7.8 billion on Friday, the highest yearly level. Rising TVL indicates growing activity and interest within BNB’s ecosystem, suggesting that more users are depositing or utilizing assets within BNB-based protocols.
 (1)-1758257335884-1758257335885.jpeg)
BNB TVL chart. Source: Artemis Terminal
The derivatives front further support the bullish outlook. CoinGlass’ data show that the futures’ Open Interest (OI) in BNB at exchanges reached a new all-time high of $1.98 billion on Friday. An increasing OI represents new or additional money entering the market and new buying, which could fuel the current BNB price rally.

BNB open interest chart. Source: CoinGlass
Another bullish sign is CoinGlass’s BNB long-to-short ratio, which stands at 1.16, nearly its monthly high. This ratio, above one, reflects bullish sentiment in the markets, as more traders are betting on the asset price to rise.
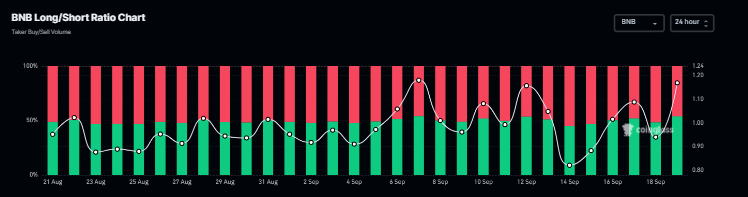
BNB long-to-short ratio chart. Source: CoinGlass
BNB Price Forecast: What's next?
BNB price reached a record high of $944.95 on Sunday but failed to maintain the gains, declining slightly to start the week. However, BNB continued its upward trend on Tuesday, rallying over 7% to reach a new all-time high of $1,006 on Thursday. At the time of writing on Friday, it trades at around $989.
If BNB continues its upward momentum, it could extend the gains to test the 141.4% Fibonacci extension level at $1,215.48.
The Relative Strength Index (RSI) on the daily chart reads 73, pointing upward, above its overbought conditions, indicating strong bullish momentum. Additionally, the Moving Average Convergence Divergence (MACD) showed a bullish crossover last week, which remains in effect, supporting the bullish thesis.
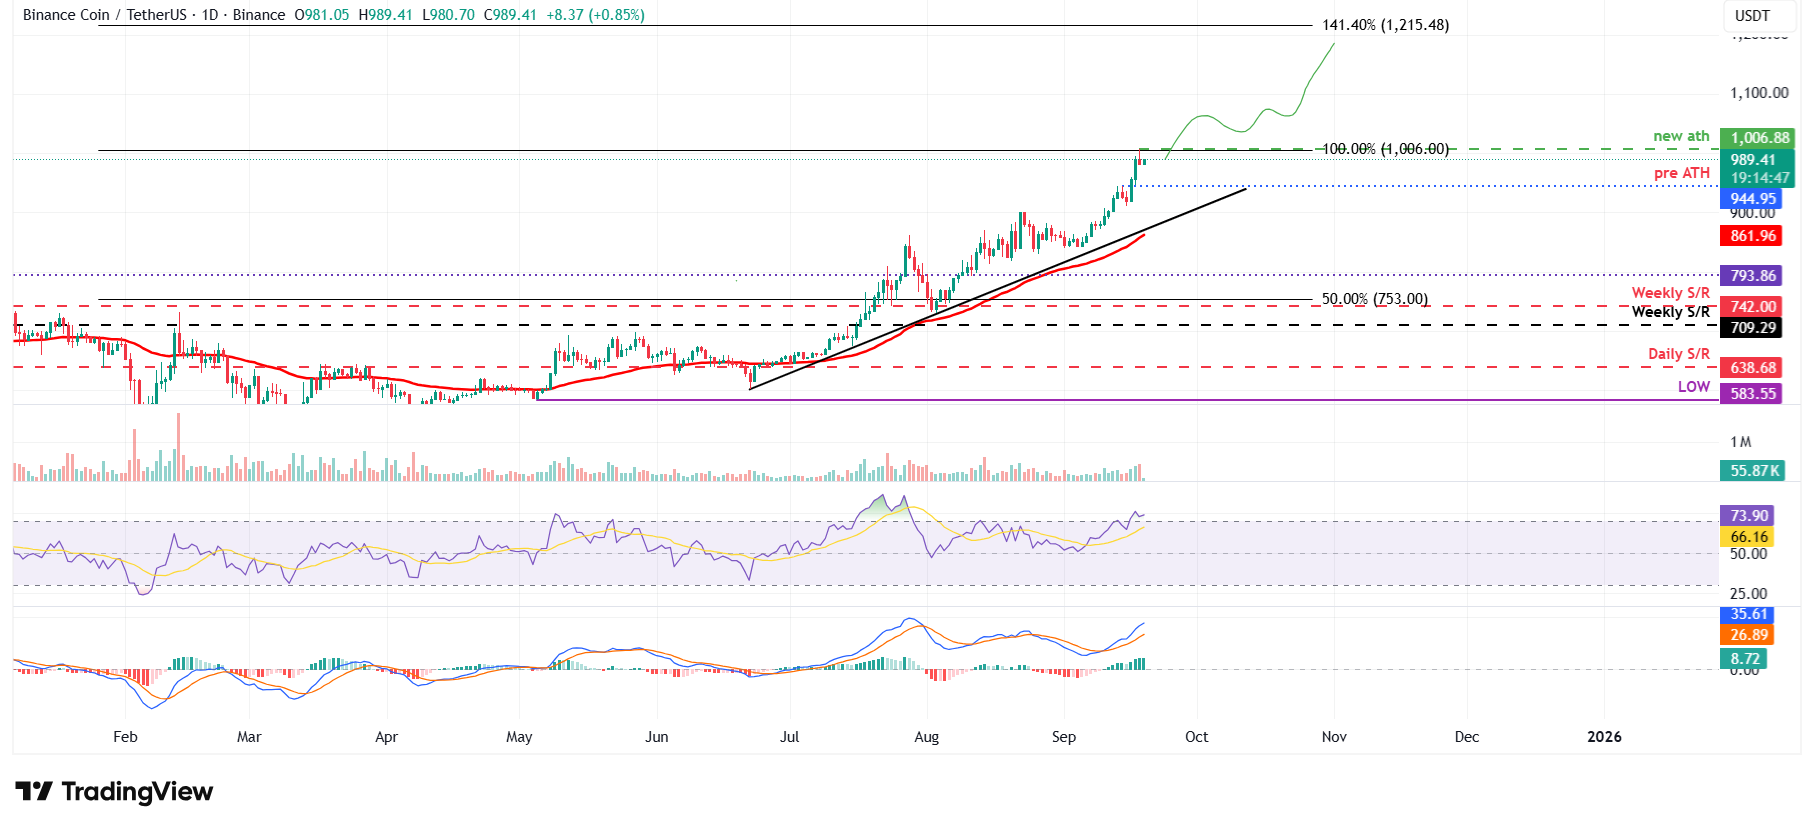
BNB/USDT daily chart
However, if BNB faces a pullback, it could extend the decline toward its previous ATH at $994.95.
Author

Manish Chhetri
FXStreet
Manish Chhetri is a crypto specialist with over four years of experience in the cryptocurrency industry.



