Bitcoin Price Forecast: BTC eyes $120,000 following FOMC dovish stance
- Bitcoin price trades in green above $117,000 on Thursday after rebounding from key support the previous day.
- Federal Reserve’s 25 bps interest rate cut and prospects of two more cuts this year lifted risk-on sentiment across markets.
- On-chain data highlight retail-driven equilibrium with limited whale activity, opening the door for a gradual climb toward $120,000.

Bitcoin (BTC) is gaining momentum after rebounding from key support, trading above $117,000 at the time of writing on Thursday. The rally follows the US Federal Reserve’s (Fed) 25-basis-point (bps) rate cut decision on Wednesday. Moreover, the possibility of additional cuts later this year further fueled risk-on sentiment across the cryptocurrency market.
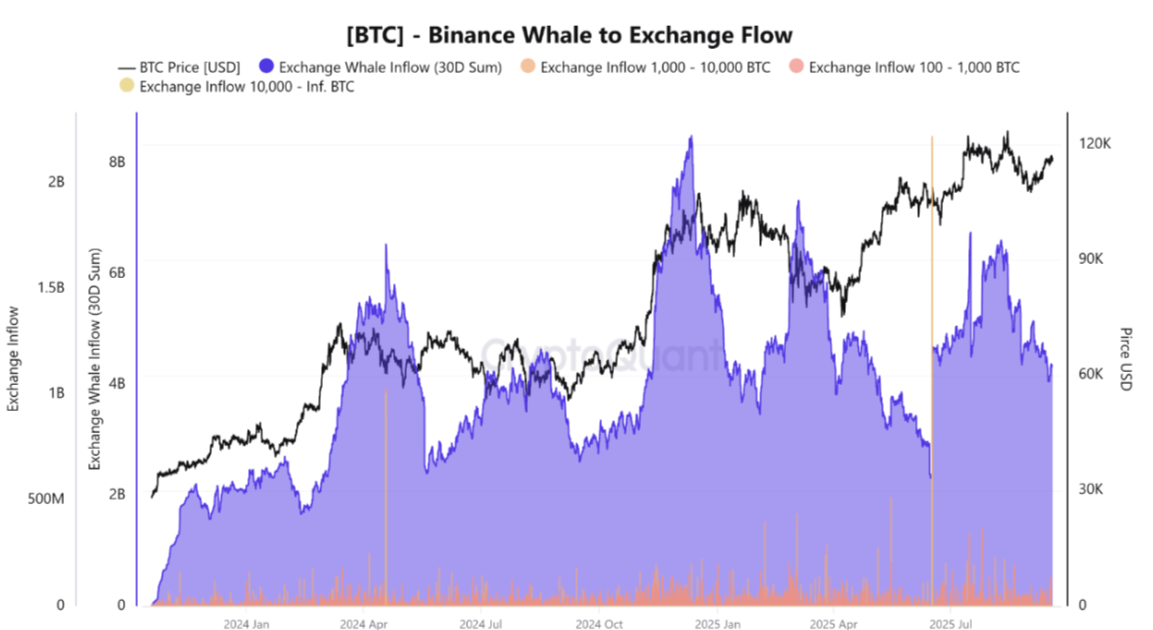
On-chain data suggests that retail investors are currently steering the market as whale activity remains muted, creating conditions for a steady climb that could see BTC test the $120,000 mark.
Bitcoin trades above $117,000 following the Fed's 25 bps rate cut
Bitcoin price holds above $117,000 in Thursday’s European session, after rebounding from the $116,000 support level following the Federal Open Market Committee’s (FOMC) 25 bps rate cut on Wednesday, which fueled risk appetite across crypto markets.
Market participants largely anticipated the 25 bps rate cut as explained in the previous report, but attention centered on the FOMC’s latest Summary of Economic Projections (SEP), also known as the dot plot, which indicates that interest rates would average 3.6% by the end of 2025, below the June projection of 3.9%.
If this forecast comes true, the Fed could implement two additional 25 bps rate cuts or a single 50 bps cut in 2025, after trimming the interest rate by 25 bps on Wednesday. Moreover, in 2026, rates are projected to drop to 3.4% from the previous 3.6% and to 3.1% in 2027, below the 3.4% projected in the June dot plot. The longer-term forecast remains at 3%.
This dovish stance by the Fed triggered a risk-on sentiment, supporting riskier assets such as BTC. Traders now look forward to Thursday's US economic docket, featuring the release of the usual Weekly Initial Jobless Claims and the Philly Fed Manufacturing Survey, for some fresh impetus for Bitcoin later during the North American session.
On-chain data show a retail-driven market
CryptoQuant data indicate that Bitcoin trading on the largest exchange, Binance, reveals the absence of large whale inflows, suggesting that the market is currently driven more by individuals than by large wallets.
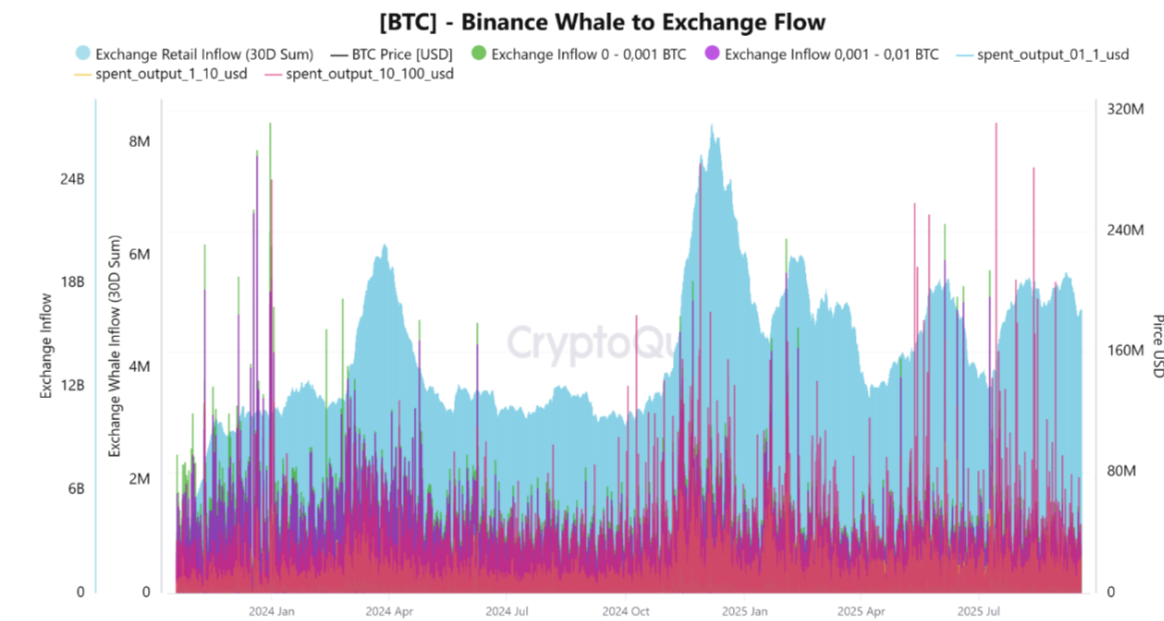
The graph below shows that the wallets holding (0 to 0.001) BTC recorded approximately 97,000 BTC, while inflows in the (0.001 to 0.01) BTC wallets amounted to about 719,000 BTC.
This accumulation pattern highlights that retail investors are currently driving the market through numerous small-volume transactions, supporting a gradual climb toward $120,000.
Though traders should remain cautious, as a sudden influx of whale activity could swiftly trigger a correction and shift market direction.
Mild dip in institutional inflow
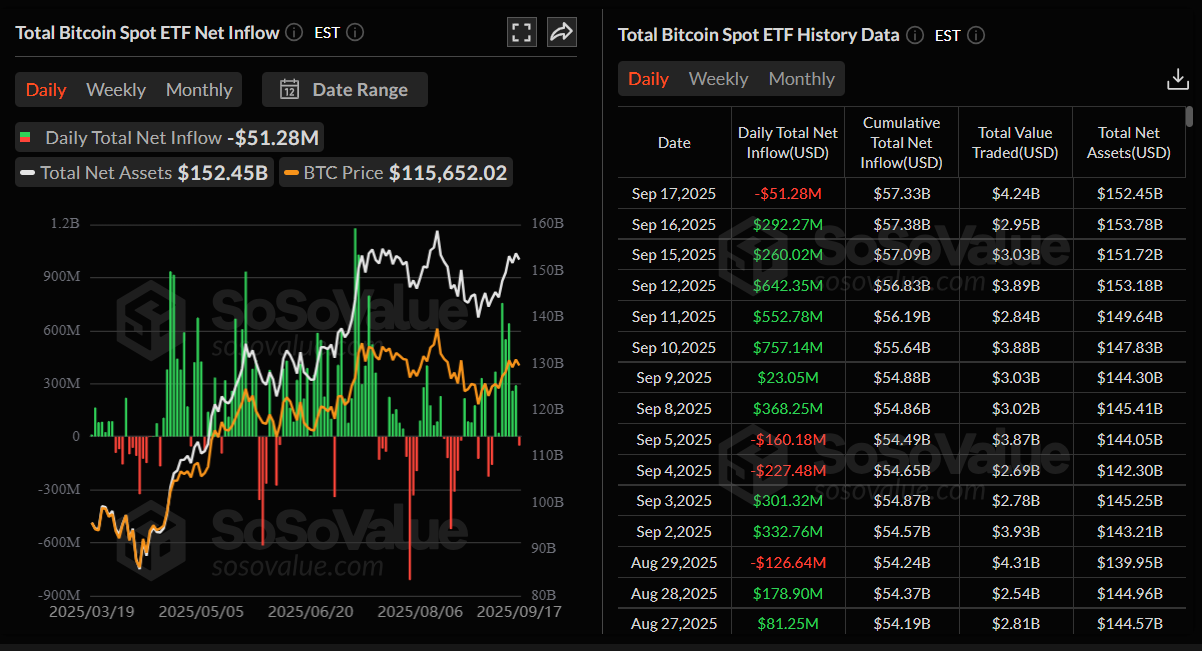
SoSoValue data shows that Bitcoin spot Exchange Traded Funds (ETFs) recorded a mild outflow of $51.28 million on Wednesday, breaking the streak of inflows since September 8.
However, these outflows remained relatively minor, as institutional investors held back from making major moves ahead of the FOMC decision, a development traders should closely monitor.
Bitcoin Price Forecast: BTC finds support around $116,000
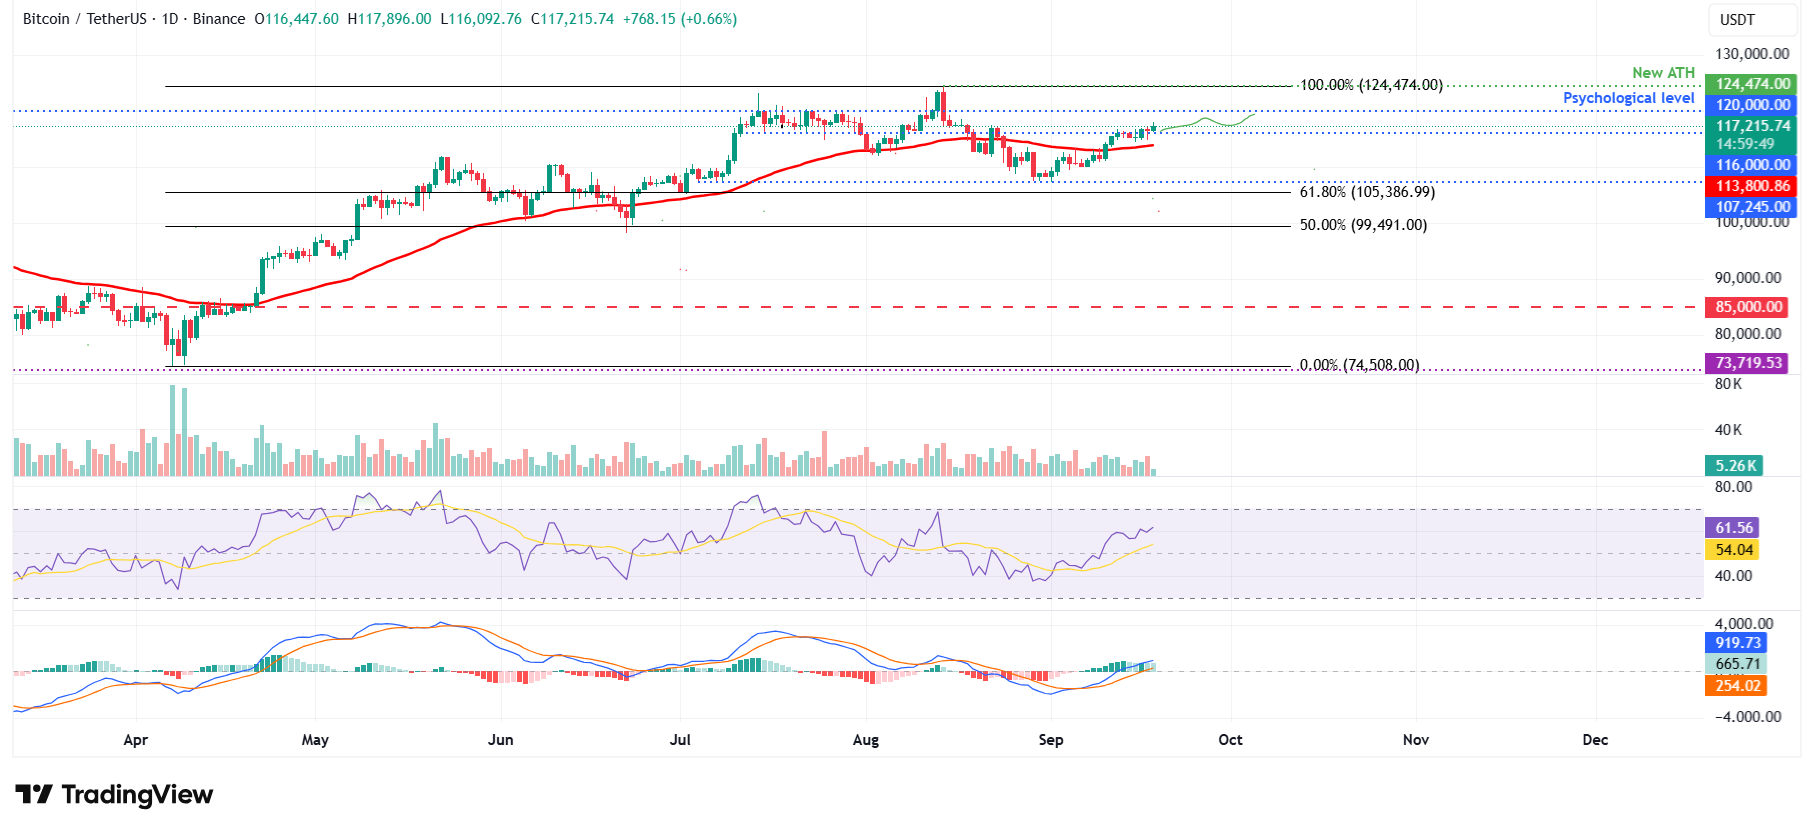
Bitcoin price recovered slightly last week but faced resistance around the daily level of $116,000 on Saturday, experiencing a mild rejection the following day. At the start of the week, Bitcoin failed to close above resistance on Monday, but by Tuesday it successfully broke through, later finding support around the same level the next day. At the time of writing on Thursday, BTC trades above $117,000.
If BTC continues its upward momentum, it could extend the rally toward the psychological level at $120,000.
The Relative Strength Index (RSI) on the daily chart reads 61, remaining steady above the midline and reflecting bullish momentum. The Moving Average Convergence (MACD) indicator on the same chart displayed a bullish crossover on September 6, which remains in effect, indicating sustained bullish momentum and an upward trend ahead.
BTC/USDT daily chart
On the contrary, if BTC corrects and closes below the $116,000 support level, it could extend the decline toward the 50-day Exponential Moving Average (EMA) at $113,800.
Bitcoin, altcoins, stablecoins FAQs
Bitcoin is the largest cryptocurrency by market capitalization, a virtual currency designed to serve as money. This form of payment cannot be controlled by any one person, group, or entity, which eliminates the need for third-party participation during financial transactions.
Altcoins are any cryptocurrency apart from Bitcoin, but some also regard Ethereum as a non-altcoin because it is from these two cryptocurrencies that forking happens. If this is true, then Litecoin is the first altcoin, forked from the Bitcoin protocol and, therefore, an “improved” version of it.
Stablecoins are cryptocurrencies designed to have a stable price, with their value backed by a reserve of the asset it represents. To achieve this, the value of any one stablecoin is pegged to a commodity or financial instrument, such as the US Dollar (USD), with its supply regulated by an algorithm or demand. The main goal of stablecoins is to provide an on/off-ramp for investors willing to trade and invest in cryptocurrencies. Stablecoins also allow investors to store value since cryptocurrencies, in general, are subject to volatility.
Bitcoin dominance is the ratio of Bitcoin's market capitalization to the total market capitalization of all cryptocurrencies combined. It provides a clear picture of Bitcoin’s interest among investors. A high BTC dominance typically happens before and during a bull run, in which investors resort to investing in relatively stable and high market capitalization cryptocurrency like Bitcoin. A drop in BTC dominance usually means that investors are moving their capital and/or profits to altcoins in a quest for higher returns, which usually triggers an explosion of altcoin rallies.
Author

Manish Chhetri
FXStreet
Manish Chhetri is a crypto specialist with over four years of experience in the cryptocurrency industry.



