BNB Price Forecast: Bulls eye $1,000 as rising TVL and stablecoin supply boost outlook
- BNB price rebounds on Tuesday after a brief pullback earlier in the week.
- On-chain data paints a bullish picture, with rising TVL and stablecoin supply both nearing record highs.
- The technical outlook suggests a rally, with bulls targeting the $1,000 mark.

BNB (BNB), formerly known as Binance Coin, is back in recovery mode, trading above $930 at the time of writing on Tuesday after a minor dip earlier this week. On-chain data fuel bullish sentiment, with BNB’s Total Value Locked (TVL) and stablecoin supply nearing record highs. Meanwhile, the technical indicators point to a potential rally toward the $1,000 mark.
On-chain metrics show a bullish bias
Arthemis Terminal data shows that BNB’s TVL increased to $7.74 billion on Sunday from $7.3 billion on September 2, nearing its record high levels of $7.8 billion. Rising TVL indicates growing activity and interest within BNB’s ecosystem, suggesting that more users are depositing or utilizing assets within BNB-based protocols.
-1758007397257-1758007397270.jpeg)
BNB TVL chart. Source: Artemis
Apart from rising TVL, Artemis terminal data show that BNB’s stablecoin total supply has risen since mid-July and currently stands at $11.2 billion. Such stablecoin activity and value increase on the BNB project indicate a bullish outlook, as they boost network usage and can attract more users to the ecosystem.
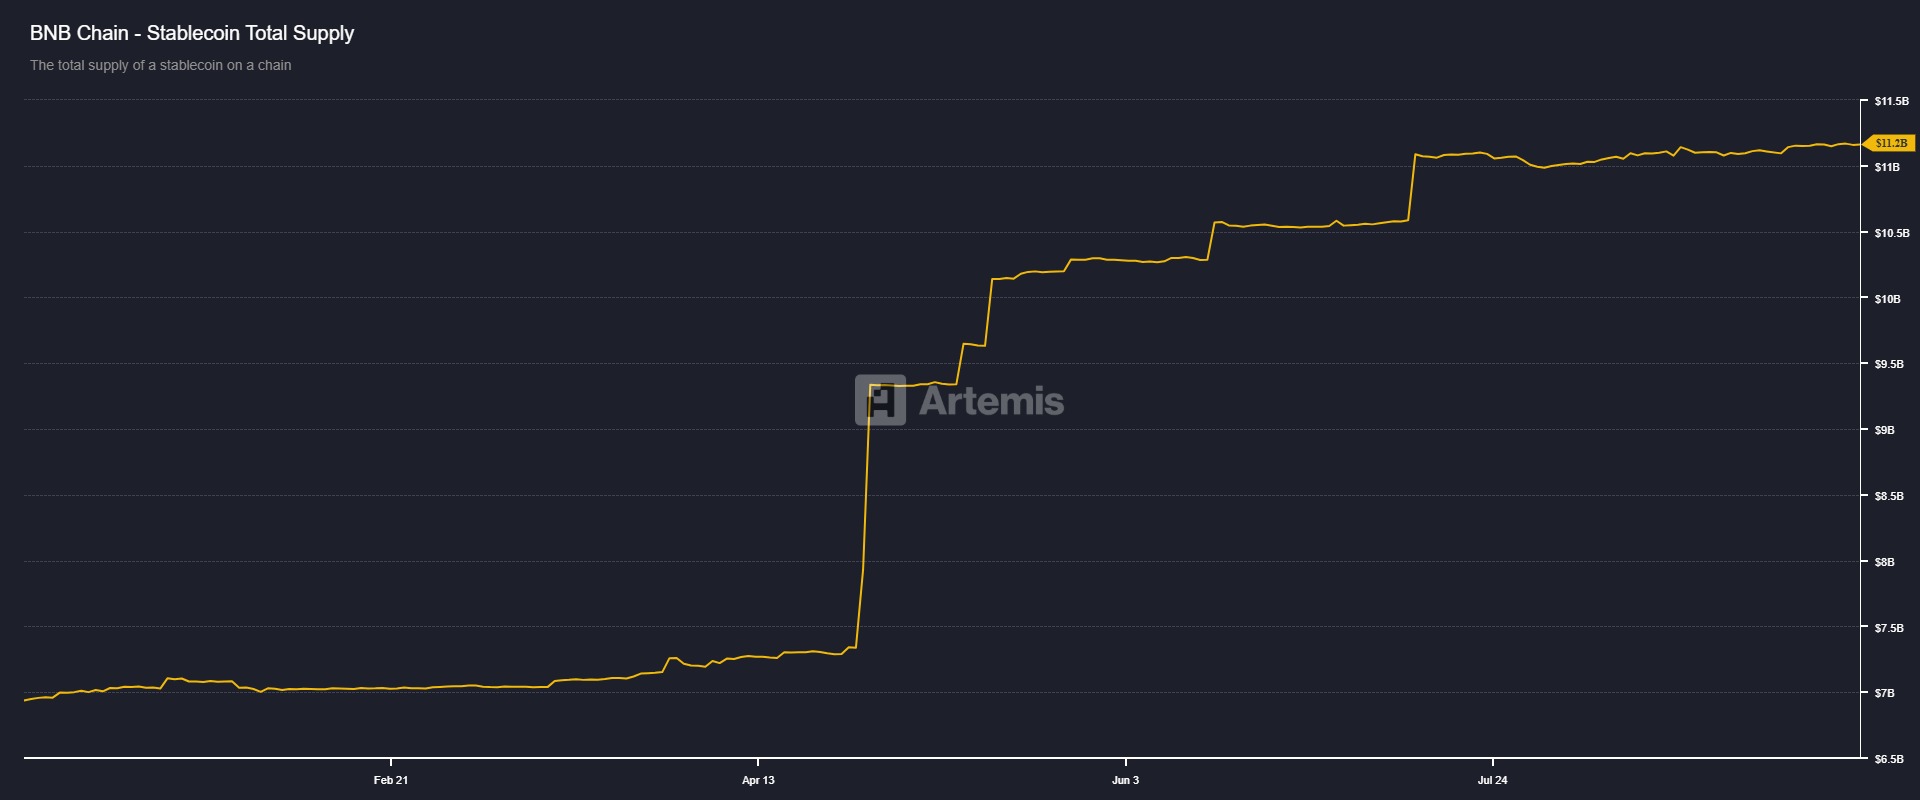
BNB stablecoin total supply chart. Source: Artemis
On the derivatives front, BNB’s futures’ Open Interest (OI) at exchanges stands at $1.66 billion on Tuesday, nearing its record highs. Rising OI represents new or additional money entering the market and new buying, which could fuel the current BNB price rally.
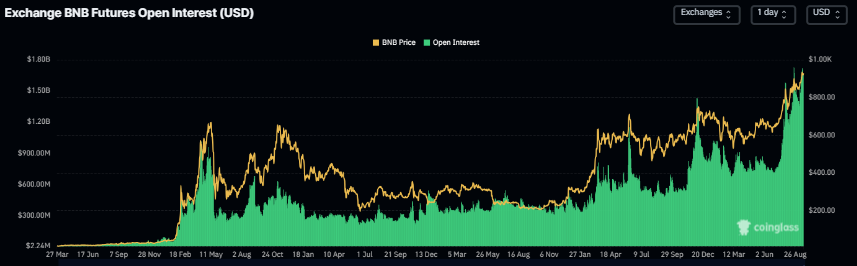
BNB open interest chart. Source: Coinglass
BNB Price Forecast: Will BNB hit $1,000 mark?
BNB price reached a new all-time high of $944.95 on Sunday, but failed to maintain the gains and declined slightly to start the week. At the time of writing on Tuesday, BNB recovers slightly, trading above $929.
If BNB continues its recovery and closes above its record high of $944.45, it could extend its gains toward its psychological level of $1,000.
The Relative Strength Index (RSI) on the daily chart reads 66, pointing upward and well below overbought conditions, indicating bullish momentum. Additionally, the Moving Average Convergence Divergence (MACD) showed a bullish crossover last week, which remains in effect, supporting the bullish thesis.
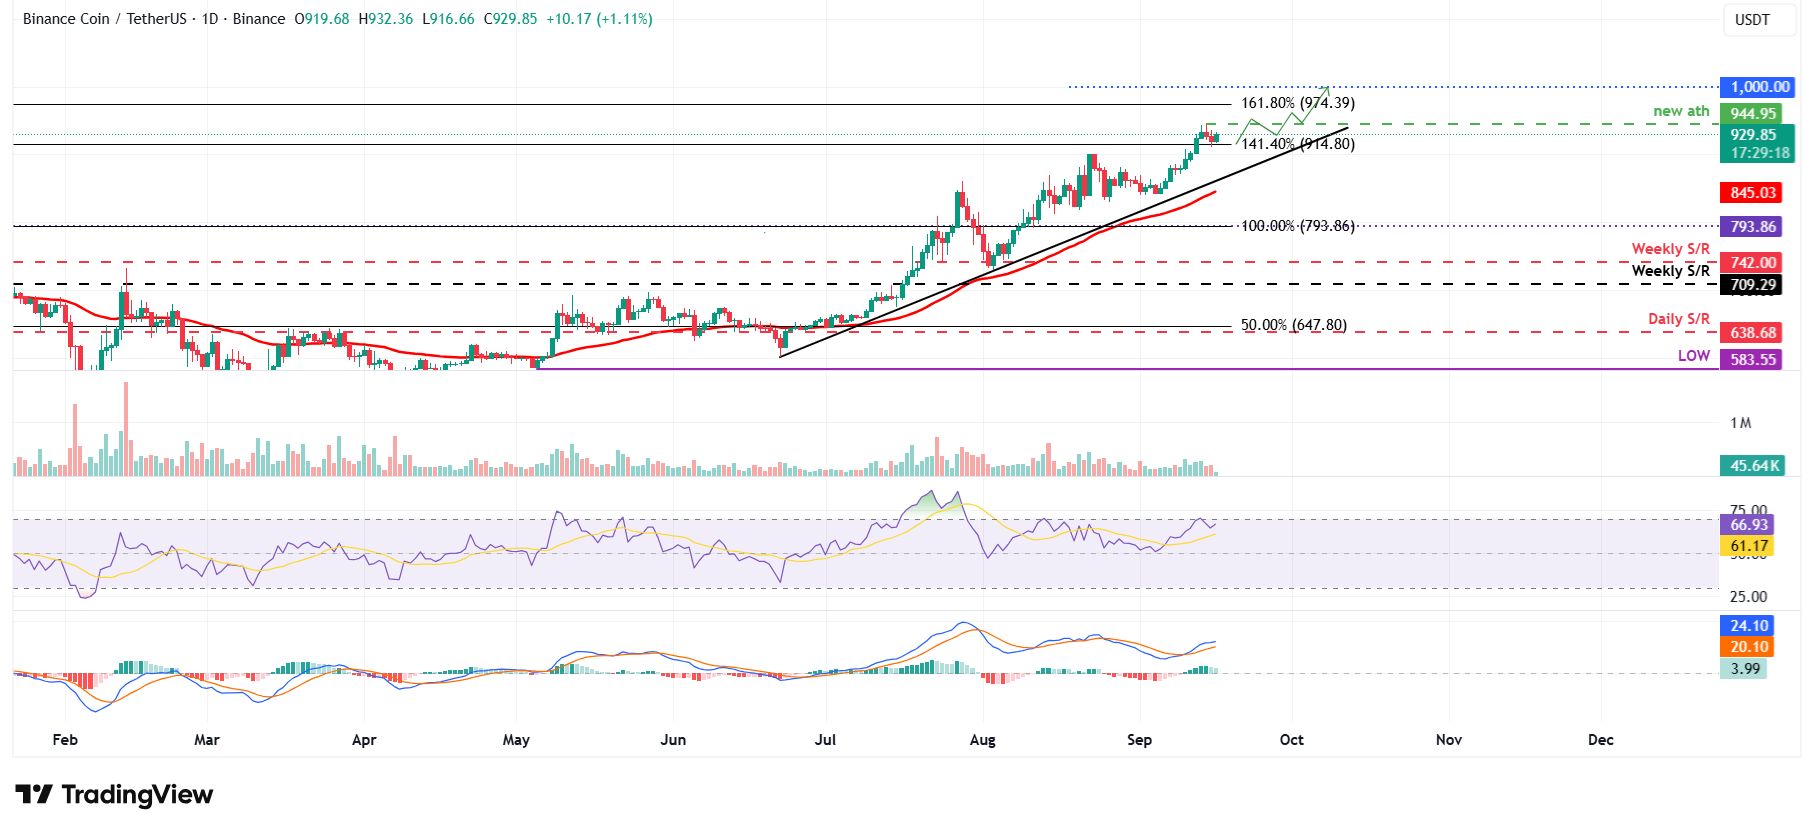
BNB/USDT daily chart
However, if BNB faces a correction, it could extend the decline toward its key psychological support at $900.
Author

Manish Chhetri
FXStreet
Manish Chhetri is a crypto specialist with over four years of experience in the cryptocurrency industry.


