Bitcoin's bollinger bands are at narrowest level for 2018

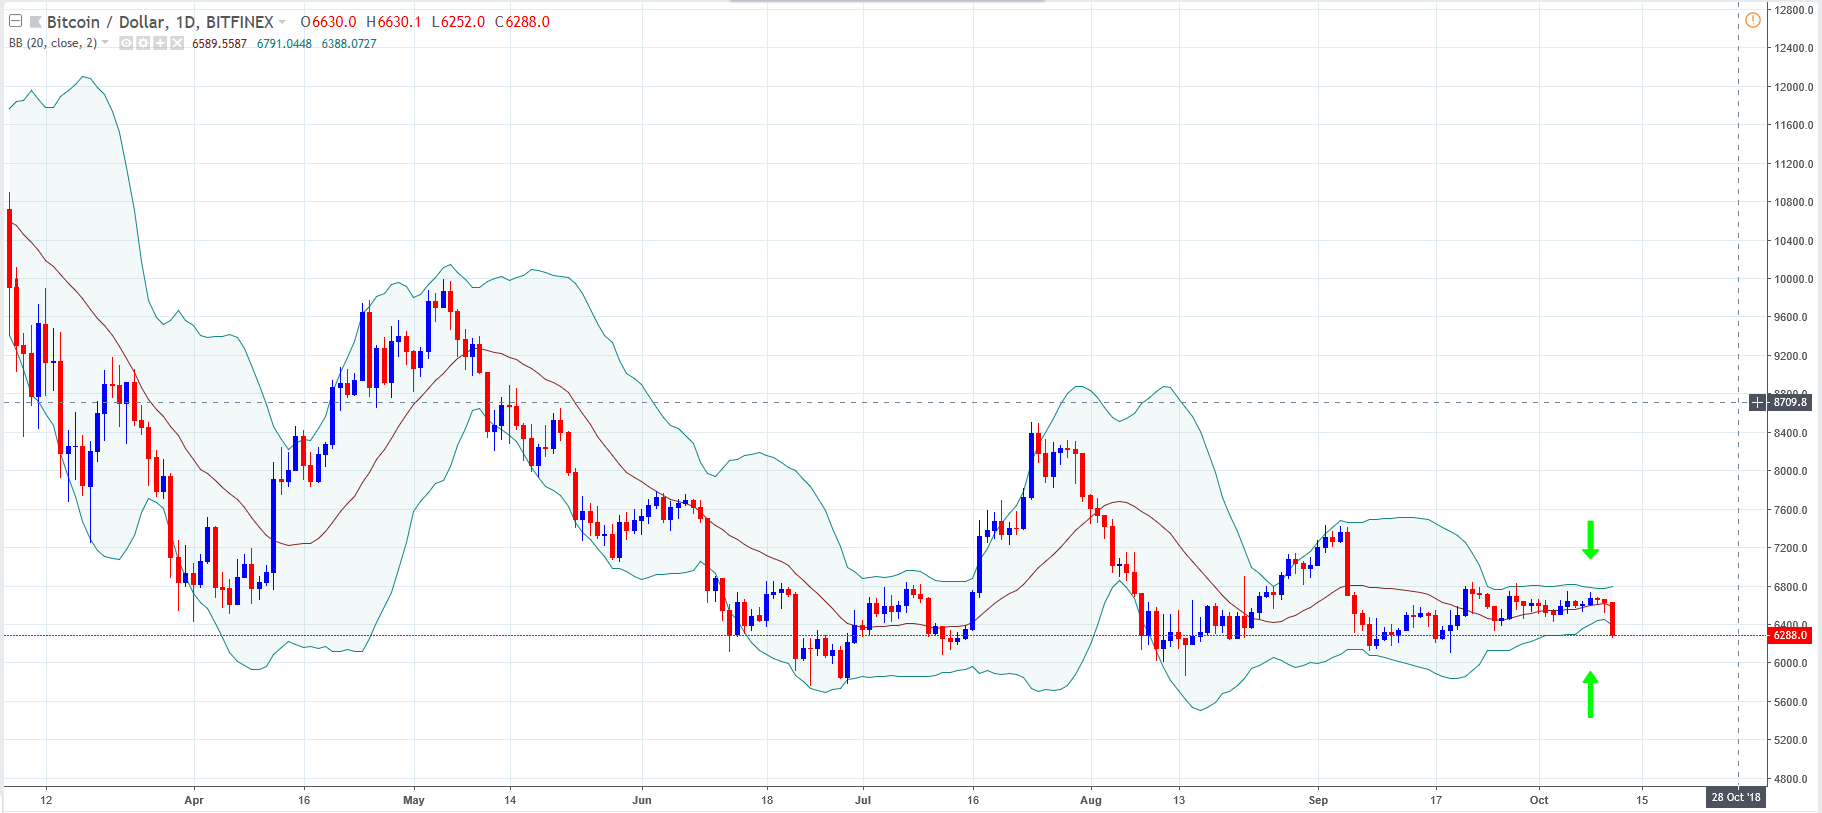
The above chart shows daily price action. Bitcoin has been drifting sideways for most of 2018. However, the Bollinger bands are now at their narrowest for this year (green arrows). Usually a narrowing of the Bollinger bands, which indicates a contraction in volatility, is the calm before the proverbial storm. I.e. after a narrowing there is usually an explosion of volatility. Please note that the Bollinger bands are not able to tell in which direction the price will move, just that there will be an increase in volatility.
Author

Russell Shor (MSTA, CFTe, MFTA) has an Honours Degree in Economics from the University of South Africa and holds the coveted Certified Financial Technician and Master of Financial Technical Analysis qualifications from the Interna


