Bitcoin: Will global liquidity push it higher?

In our previous update (see here), we showed how our long-term crypto-trading-alert system provided staggering returns for Bitcoin (BTC):
“Five trades have been executed since 2012, with a sixth underway since February 28, 2023. It is currently up ~200%. Two trades were losses (-16.1% and -31.2%); three were winners (+9,480%, +1,960%, +346%). Thus, our trading systems kept losers small and allowed winners to run as any sound system should.”
Besides, by reinvesting those profits, we showed that following the trading system's alerts could increase that to a >500,000% return on investment (ROI) in 13 years. Talk about a no-brainer deal.
But for those who prefer a more self-informed approach instead of a trading system that tells us what to do, we must assess the price charts in detail. A reliable way to do so is the Elliott Wave (EW) Principle, combined with several other tools, allowing us to provide a weight of the evidence approach. Figure 1 below shows our preferred EW count since the late 2022 low. Here, in uptrends, we count down-weeks as corrective (2nd and 4th waves); in downtrends, we count up-weeks as corrective (b-waves). Using this simple yet elegant method, we can account for >98 percent of the price action.
Bitcoin’s weekly action since the 2022 low with our preferred Elliott Wave count
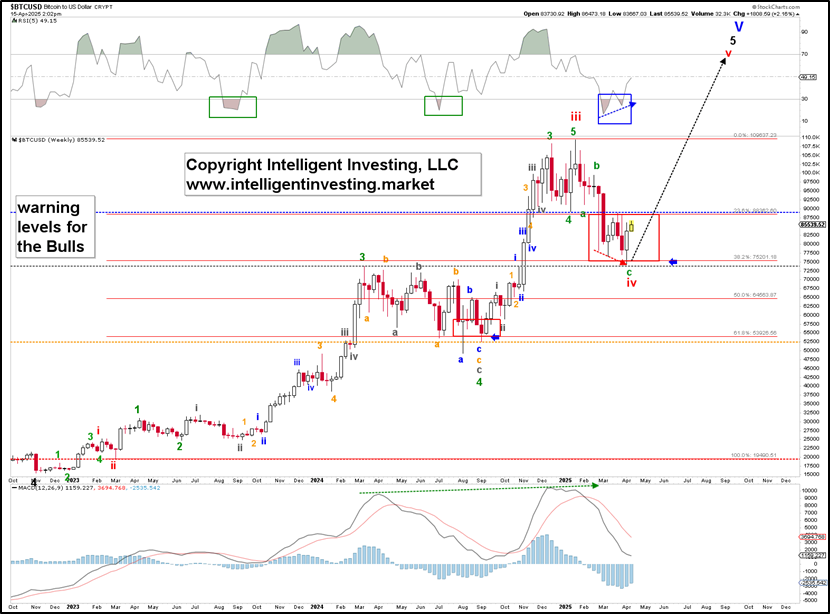
Ideally, BTC should have completed the red W-iv and is about to commence the red W-v, preferably to $166K. In previous updates, we have shown why we prefer that target (spoiler alert: it is based on Fibonacci extensions). At last week’s low, BTC did an almost perfect 38.2% retracement of the red W-iii, a common target for a 4th wave. Besides, the previous (green) 3rd wave high was successfully retested at that low. Thus far, it is classic technical behavior. Further support is a little lower, between $68,500 and $71,500.
To supplement the EW count, we can look at other vital indicators. In this case, liquidity. It drives markets, i.e., how much is there and how much it wants to be put to work in the financial markets. We can easily quantify the former, which we have done here. We overlaid BTC’s price action since its low in 2022 with Global M2 Money Supply (GMS) as per Collin Talks Crypto (@CollinTCrypto), using a 98- and 112-day offset. See Figure 2 below. Bitcoin’s daily price action is in white, and the GMS is in blue and yellow, respectively.
Bitcoin’s daily price action (white) with 98-day (blue) and 112-day (yellow) offset GMS
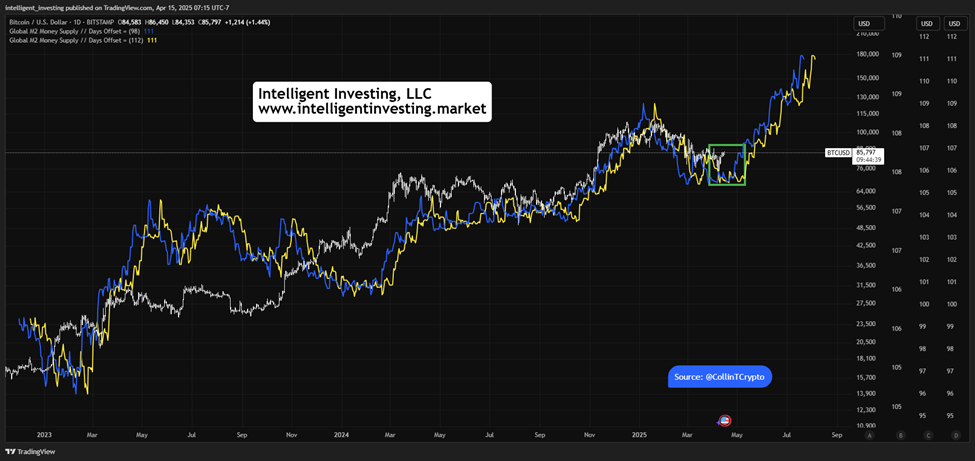
Although the correlation is not perfect (~70-80%), aka “60% of the time it works every time…” and sometimes the 98-day matches better than the 112-day offset and vice versa, we can see that BTC has almost moved in lockstep with GMS. But the main message here is on the right-hand side of the chart, where GMS is due to the offset forward-plotted to August. It starts trending back up in late April and early May (green box), i.e., right around now, and will reach new all-time highs in June. Assuming this correlation between Bitcoin and GMS holds, we can conclude that BTC’s price will rise rapidly. Moreover, this outcome is in line with our preferred EW count.
Thus, we find good alignment with global liquidity and our EW count, which increases our confidence in Bitcoin’s next likely move. Lastly, this level of detail and cross-comparison makes our work unique and robust, unlike using the EW in a vacuum, as that leads to too many outcomes.
Author

Dr. Arnout Ter Schure
Intelligent Investing, LLC
After having worked for over ten years within the field of energy and the environment, Dr.


