Bitcoin trapped between crucial support and resistance zones
-
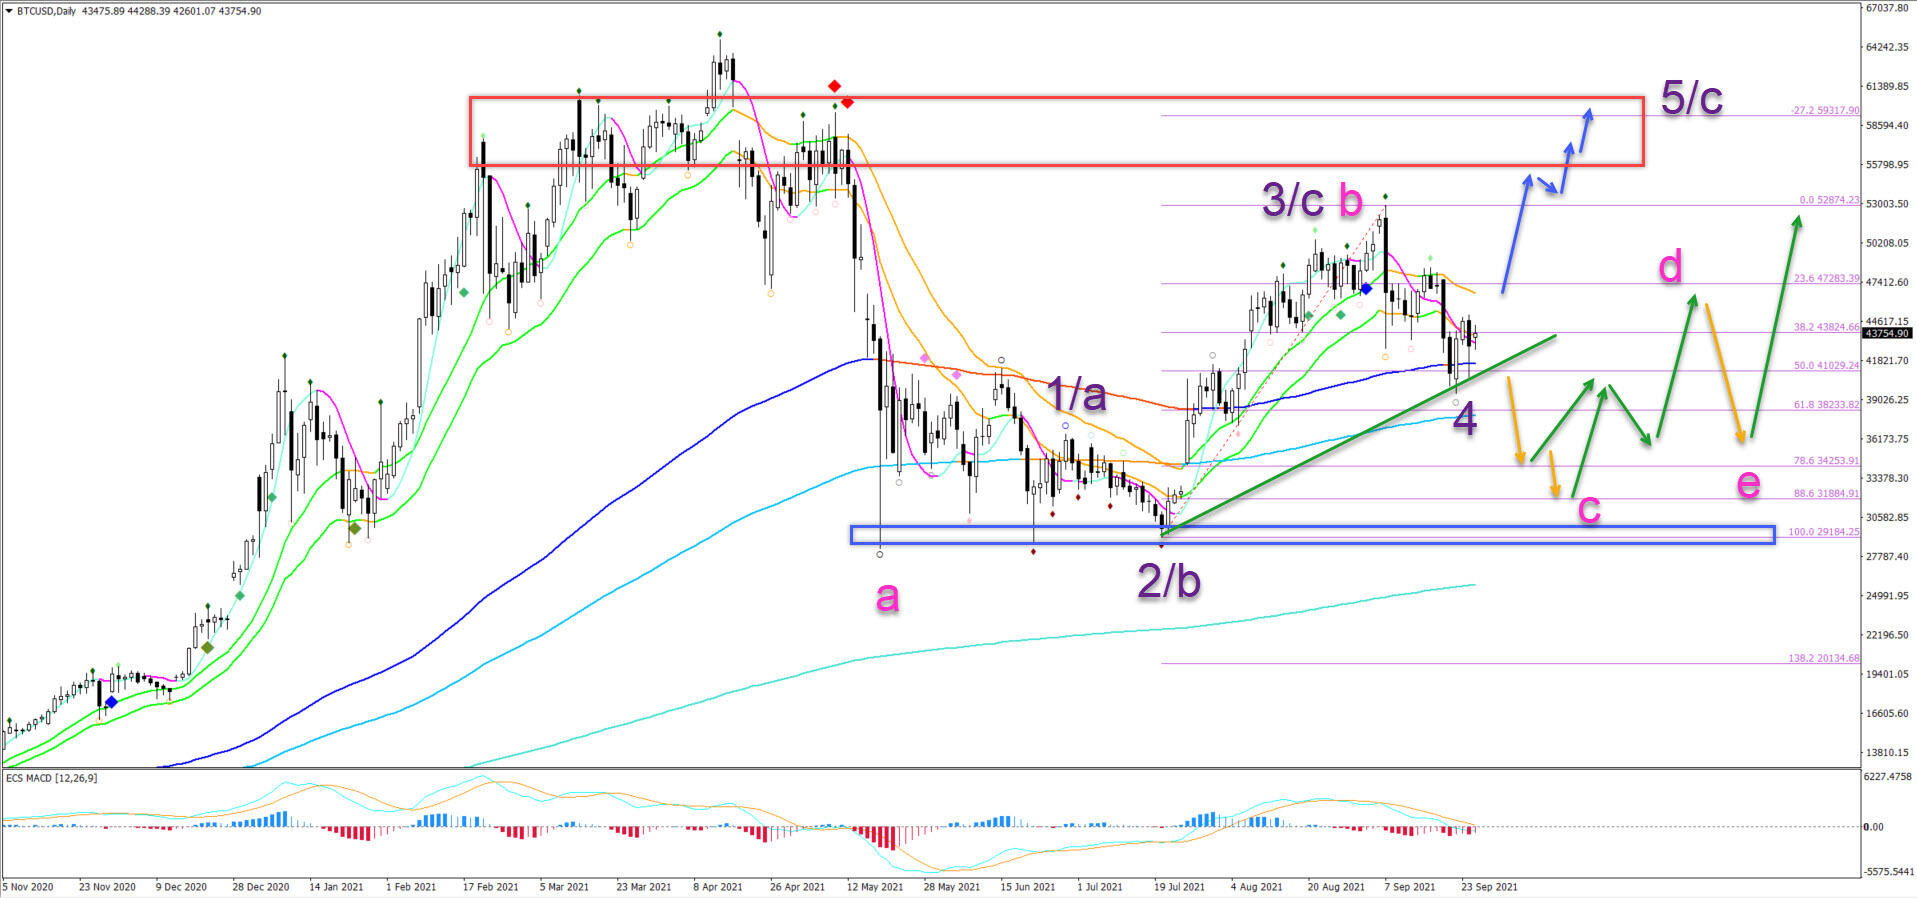
Bitcoin (BTC/USD) has arrived at a critical decision zone. Will price action respect the 144 ema support on the daily chart?
-
The BTC/USD seems to be trending lower but the price action has been slow and choppy so far. Price action also made a bullish bounce at the 144 ema.
-
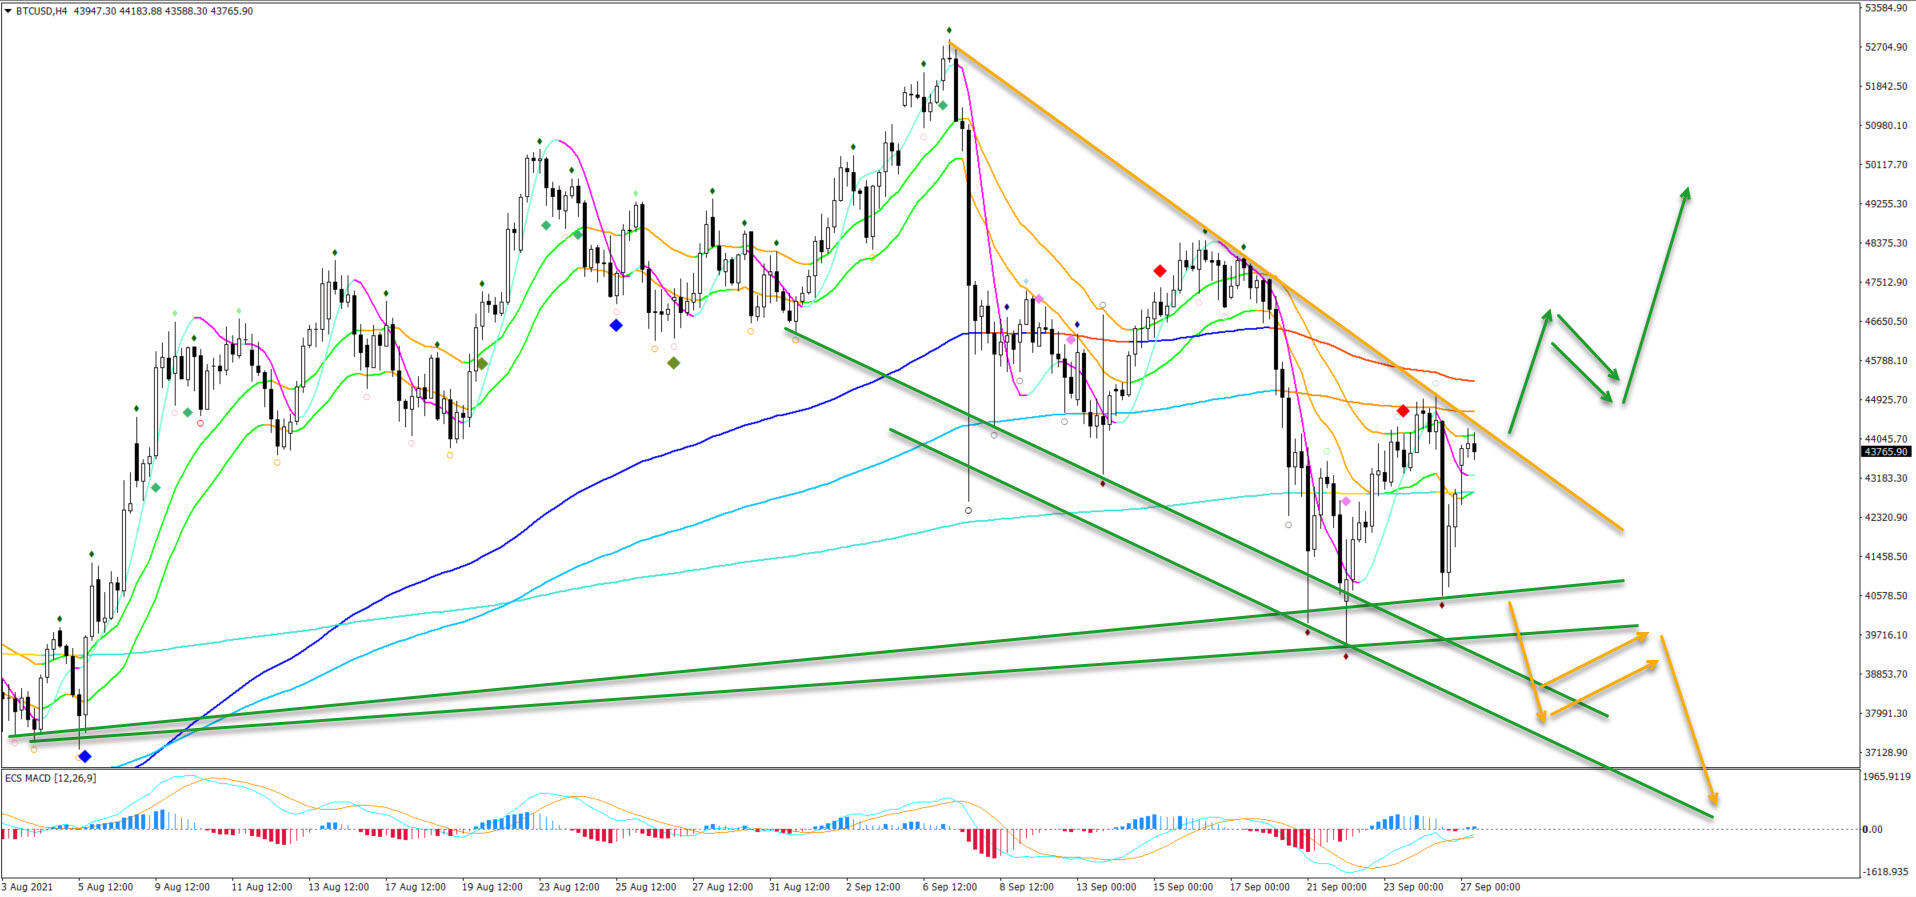
On the 4 hour chart, price action is in a downtrend channel but also facing a strong support zone.

Let’s review the two most realistic scenarios for the BTC/USD in the near future on the daily and 4 hour charts.
Price charts and technical analysis
The BTC/USD seems to be trending lower but the price action has been slow and choppy so far. Price action also made a bullish bounce at the 144 ema:
-
A bullish breakout above the 21 ema zone could confirm an uptrend continuation.
-
The main target is the resistance box (red) and -27.2% Fibonacci target.
-
This could complete either a bullish ABC or be part of a larger 12345 wave pattern. This depends on whether price action bounces at or breaks above the top.
-
If price action, however, breaks below the support line (green) and 144 ema, then a deeper bearish pullback (orange arrow) is expected.
-
A contracting triangle chart pattern could take place via an ABCDE (pink).
-
A bullish bounce and breakout (green arrows) is expected later on.
On the 4 hour chart, price action is in a downtrend channel but also facing a strong support zone:
-
The breakout is key for determining the next price swing.
-
A break, pullback and continuation pattern would help determine whether the breakout is not a false break.
-
A bullish breakout (green arrows) is needed above the resistance trend line (orange) and moving averages.
-
A bearish breakout (orange arrows) is needed below the support trend lines (green).
The analysis has been done with the indicators and template from the SWAT method simple wave analysis and trading. For more daily technical and wave analysis and updates, sign-up to our newsletter
Author

Chris Svorcik
Elite CurrenSea
Experience Chris Svorcik has co-founded Elite CurrenSea in 2014 together with Nenad Kerkez, aka Tarantula FX. Chris is a technical analyst, wave analyst, trader, writer, educator, webinar speaker, and seminar speaker of the financial markets.


