Bitcoin topped in March; Is there more downside to come?

As the first of hopefully many articles about Bitcoin (BTCUSD), we wanted to share our thoughts on the price action since its March high. We primarily use the Elliott Wave Principle (EWP) and find that the August 5th low at $49,202 was most likely the c-wave of double zigzag: WXY (abc-abc). These patterns are highly complex with many unforeseen twists and turns and thus challenging to forecast, which is also frustrating for traders. Hence, the Crypto Fear and Greed Index is still at only 39 (on a scale of 0-100, that is Fear), whereas BTC is only 18% below its all-time high set in March ($74K).
This means the potential green W-4 we have been tracking has become more protracted. See Figure 1 below. BTC peaked in March and has gone sideways since then, a five-month-long nothing burger. The August 5 low was well below the more typical 38.20% retracement of the green W-3, which was reached in July, and thus, the Bulls are placed on watch. But all hope is not lost.
Figure 1. The daily chart of BTCUSD with several technical indicators and EWP counts.
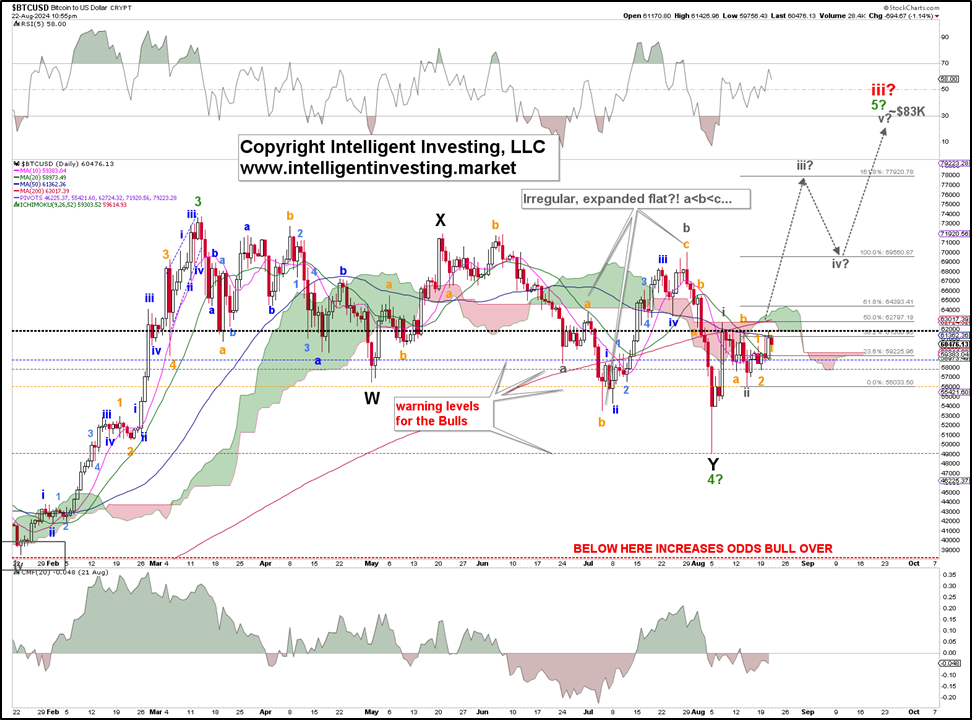
The $62000 level is critical. That level has been Support many times this year but has also acted as resistance, especially since the August 5 low. BTC has bumped into it five times now (!). Moreover, it is now also right at the (blue) 50-day Simple Moving Average (SMA) at $61360. Thus, BTC must clear that level to get any upside going. Please note the EWP count shown is one of several we are tracking. Why several? Because the price of BTC is such a sideways mess, and that's not EWP's strong suit... Thus, the Bulls' warning levels have been raised.
However, BTC is back above its 10 and 20-d SMAs, which it has been below since late July. Thus, the short-term trend has changed, but reclaiming the 50d SMA and the $62000 level is critical. That will allow a quick attack of the 200d SMA and a rally above the Ichimoku Cloud. If all that happens, the chart will turn from 80% Bearish to 40% Bullish, which will be a significant improvement. Until then, keep an eye on the warning levels because if the August 5 low has taught us anything, it is that this year’s price action is discombobulated.
Author

Dr. Arnout Ter Schure
Intelligent Investing, LLC
After having worked for over ten years within the field of energy and the environment, Dr.


