Bitcoin to $9,000 or $90,000?

The largest cryptocurrency, Bitcoin (BTCUSD), bottomed out on August 5 at $49202, rallied overlappingly until the end of the month, and sits as of writing at around $58167. An 18% gain in a month in the crypto world is not the most awe-inspiring rally, to be honest. Since our preferred analysis method is the Elliott Wave Principle (EWP), this “sloppy” price action remains, unfortunately, open to interpretation. But we are starting to see light at the end of the tunnel. See Figure 1 below.
Figure 1. The daily resolution candlestick chart of BTC/USD with several technical indicators
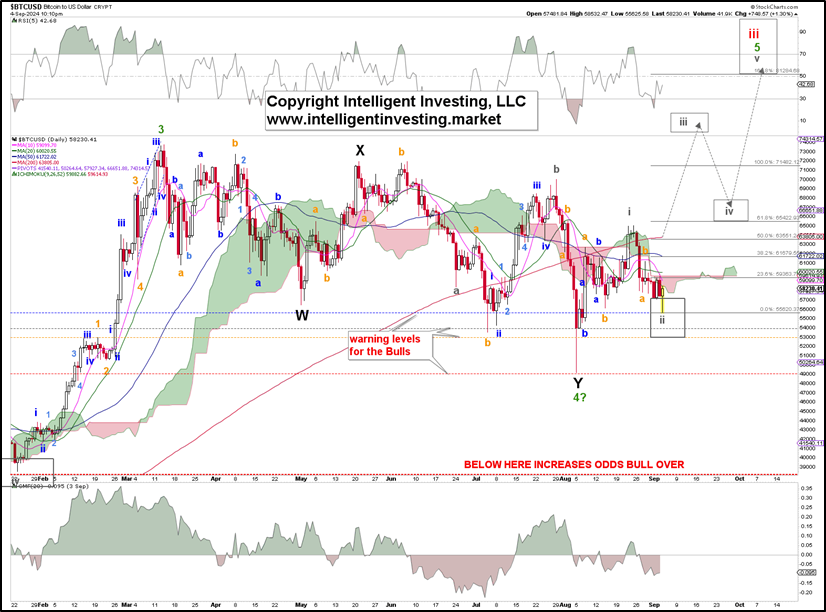
Thus far, the August 5 low has held, and as long as it does, we can allow for the (grey) wave-i, ii setup, as shown, to develop further. In this case, grey W-i and W-ii comprised both of three waves, as they could be part of an ending diagonal 5th wave. At yesterday’s low, almost 61.80% of the potential W-i rally was retraced, a typical level for a 2nd wave. However, BTCUSD is still well below its declining Ichimoku Cloud, 10-day simple moving average (d SMA) and below the declining 20d, 50d, and 200d SMA. Thus, the chart trend is still 100% Bearish, and the Bulls have a lot of work left to do. A break above the late-August high, labeled as the potential grey W-i, at $65120, is required to help tell us the grey W-iii is underway. That level is critical support/resistance, allowing BTCUSD to move back above the Cloud and SMAs.
Meanwhile, in our previous update, we also found that “if the August 5 low has taught us anything, it is that this year’s price action is discombobulated.” Regrettably, this is still the case. Namely, the Bulls' third (orange) warning level is holding, but we will have to look for the $40000s again if it fails. See Figure 2 below.
Figure 2. The daily resolution candlestick chart of BTC/USD with several technical indicators
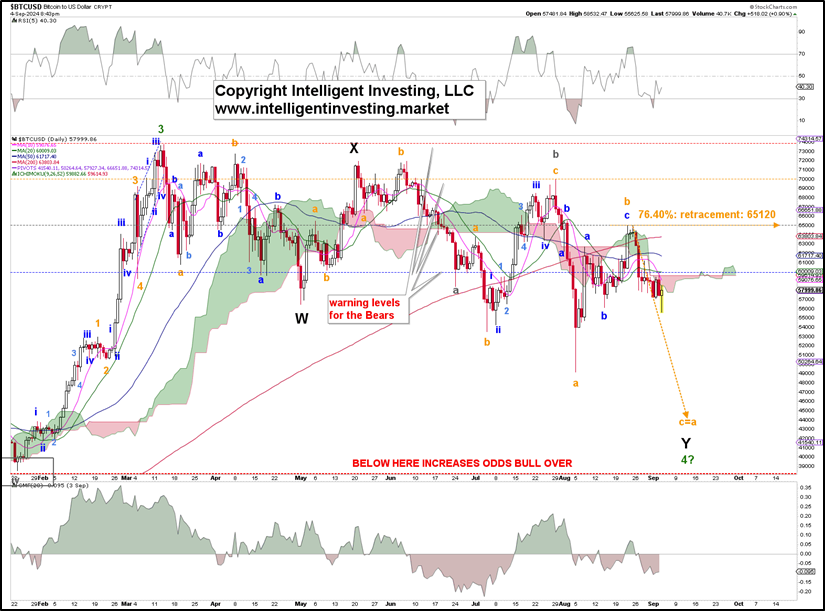
In that case, the August rally was most likely a(nother) B-wave bounce, and a final C-wave to ideally $44-48K should be expected for an even more protracted W-X-Y correction than we already have at the August low. Conversely, we have placed the warning levels for the Bears on the chart that will tell us above which prices such a lower low become less and less likely. The 1st (blue) warning will be around $59500, the 2nd at $65120, etc.
Thus, although the price action is still less than ideal, we now have simple price-based parameters to help us tell if we see lower prices first or if the August 5th low, and even yesterday’s low, will stand.
Author

Dr. Arnout Ter Schure
Intelligent Investing, LLC
After having worked for over ten years within the field of energy and the environment, Dr.




