Bitcoin Technical Analysis: BTC/USD will Bitcoin ever conquer $4000 again?
- Bitcoin price is nursing minor losses on Friday, down just some 0.40%.
- BTC/USD remains confined within a range-block via the daily time frame.
- Heavy sellers remain a problem within the early $4000 territory, preventing this being conquered by the bulls.

BTC/USD 15-minute chart
- Possible head and shoulders formation, left shoulder and head heaving been formed.
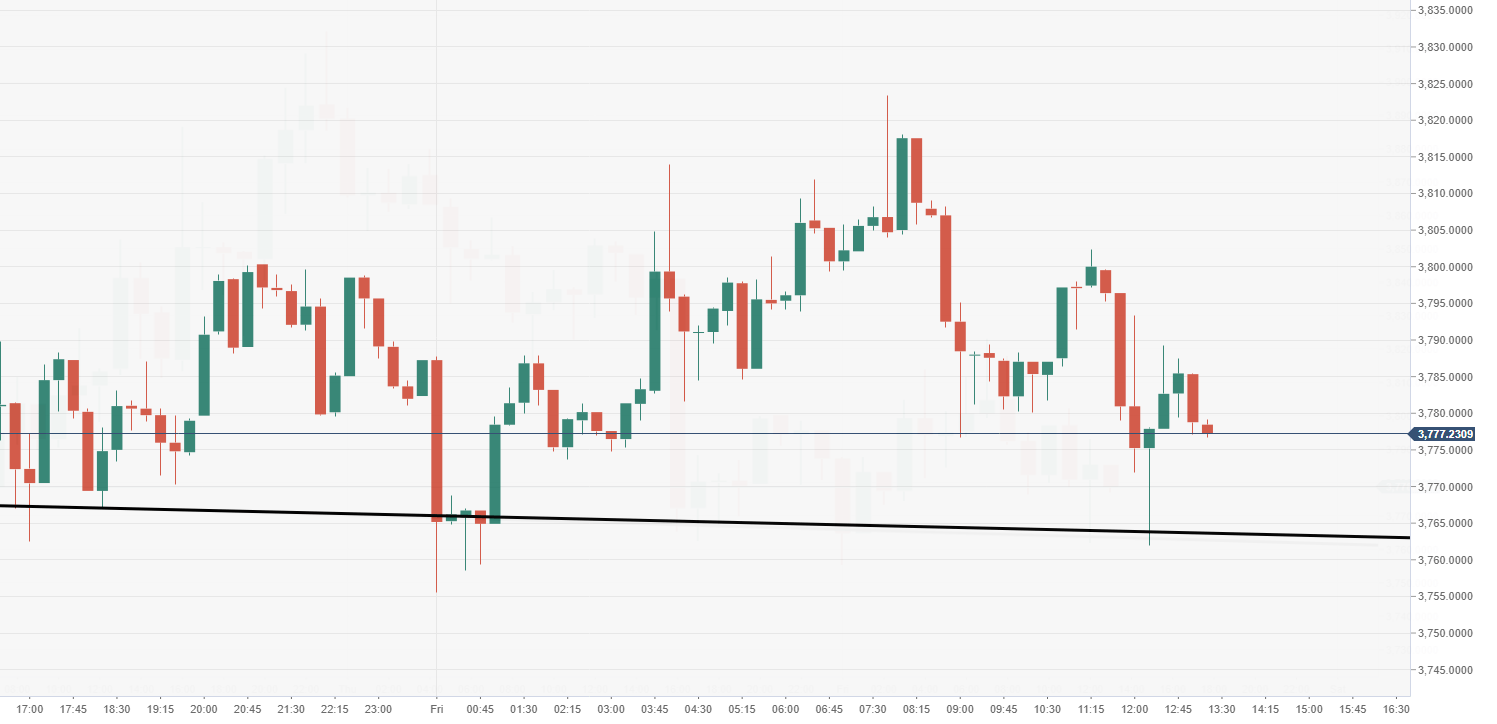
Spot rate: 3840.62
Relative change: -0.38%
High: 3823.29
Low: 3755.60
Trend: Bearish/Neutral
Support 1: 3735.70, daily pivot point support.
Support 2: 3684.15, daily pivot point support.
Support 3: 3605.78, daily pivot point support.
Resistance 1: 3865.63, daily pivot point resistance.
Resistance 2: 3944.00, daily pivot point resistance.
Resistance 3: 3995.55, daily pivot point resistance.
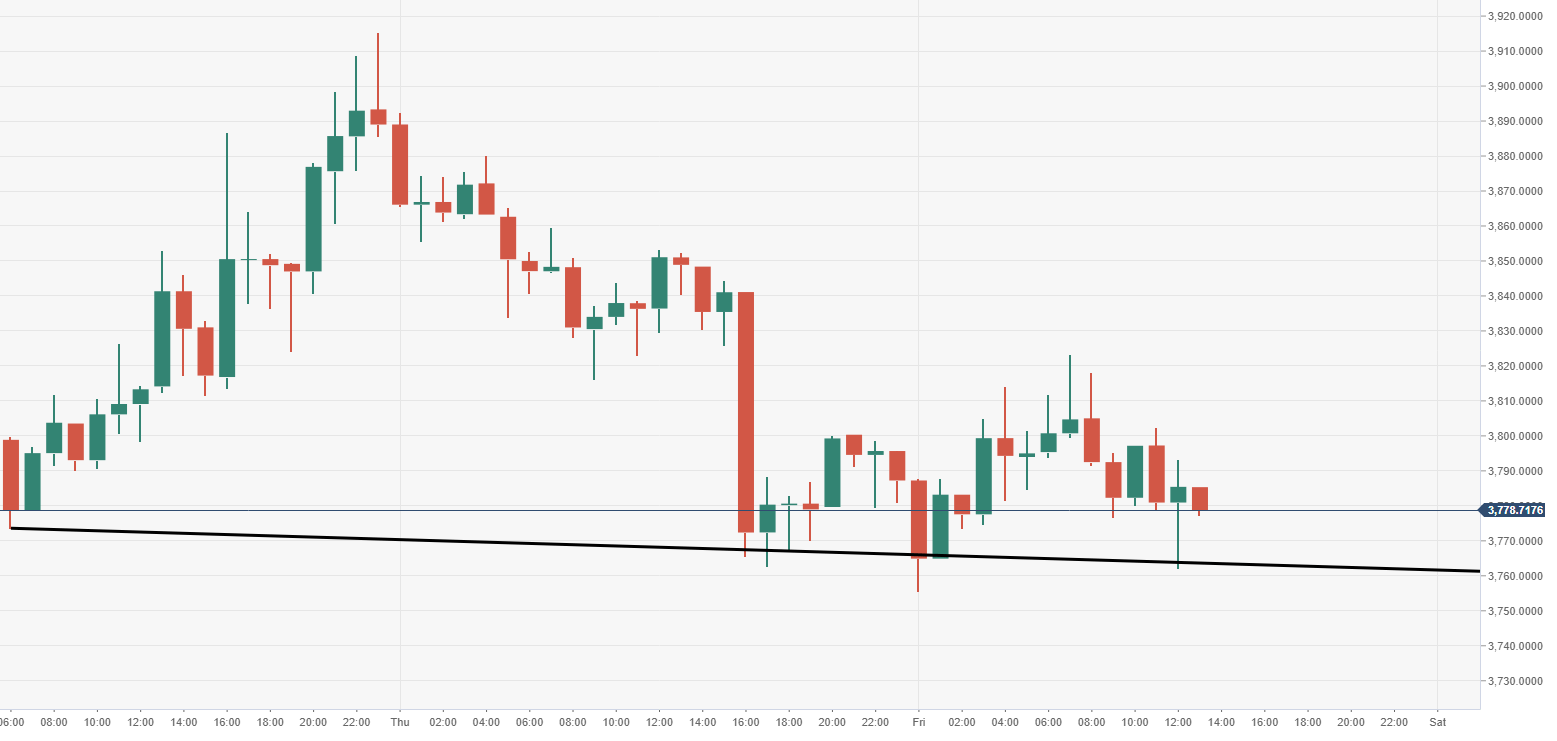
BTC/USD 60-minute chart
- BTC/USD for now is supported by a horizontal tracking trend line.
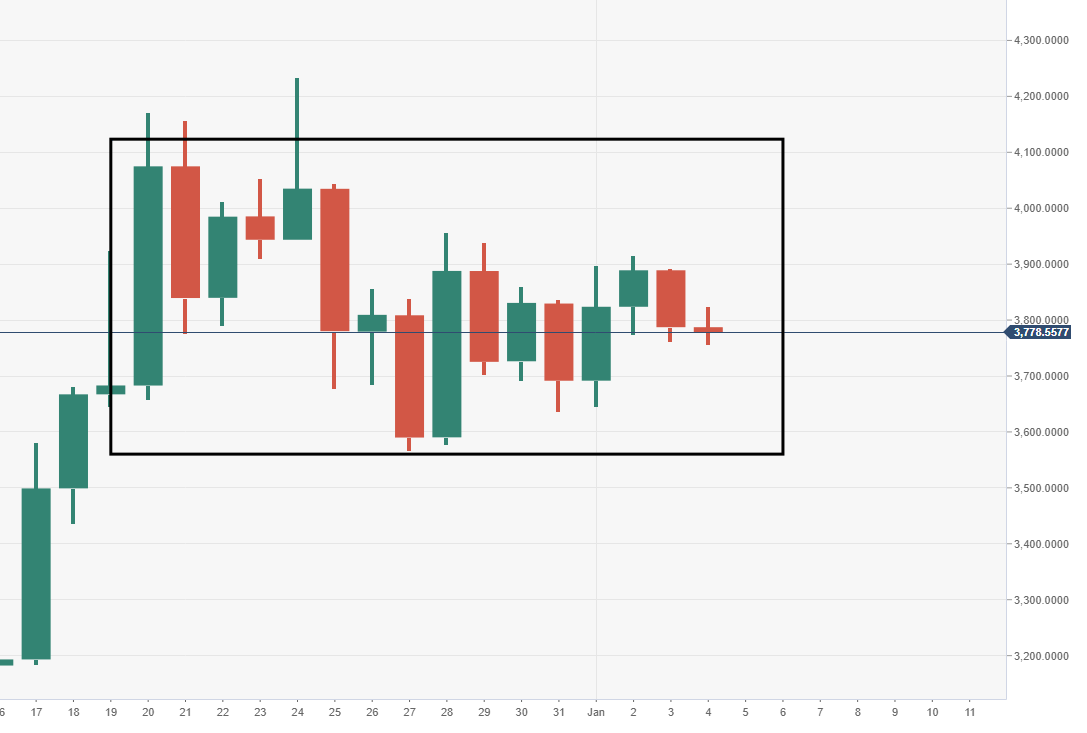
BTC/USD daily chart
- Price action continues to move within the confinements of this range-block formation.
Author

Ken Chigbo
Independent Analyst
Ken has over 8 years exposure to the financial markets. He started his career as an analyst, covering a variety of asset classes; forex, fixed income, commodities and equities.


