Bitcoin Technical Analysis: BTC/USD the sleeping bulls are close to being woken
- Bitcoin is seen nursing minor losses of around 1% on Friday, as the price continues to cool at the end of the week.
- BTC/USD price action has been forming a bullish flag pattern seen on the 60-minute chart.

BTC/USD 60-minute chart
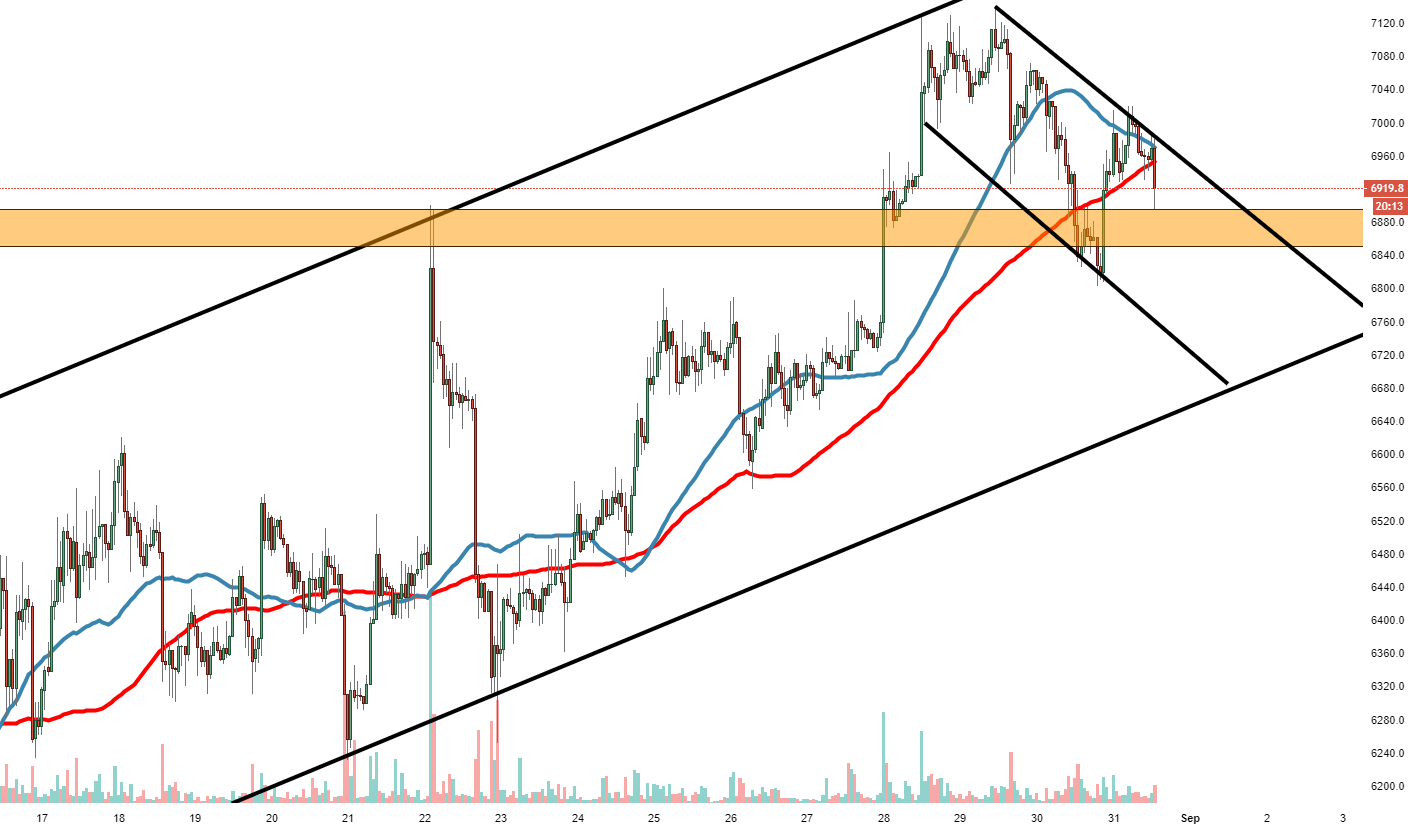
Spot rate: 6920.0
Relative change: -0.99%
High: 7019.0
Low: 6893.5
Trend: Bearish
Support 1: 6900.0, support on 60-minute chart.
Support 2: 6802.9 30 August low.
Support 3: 6767.9, lower part of channel. bull flag.
Resistance 1: 6965.1. 50MA.
Resistance 2: 6986.2, upper part of channel/flag.
Resistance 3: 7020.0, resistance on 60-minute chart.
Author

Ken Chigbo
Independent Analyst
Ken has over 8 years exposure to the financial markets. He started his career as an analyst, covering a variety of asset classes; forex, fixed income, commodities and equities.
More from Ken Chigbo


