Bitcoin Technical Analysis: BTC/USD price had big scare after briefly spiking below range-block formation
- Bitcoin price on Tuesday was seen up 1.40% after starting the session somewhat under pressure from the bears.
- BTC/USD was ever so close to a breach of the daily range-block to the downside, early in the session.
- Bulls are have some difficulty breaking down the session high area.

BTC/USD 15-minute chart
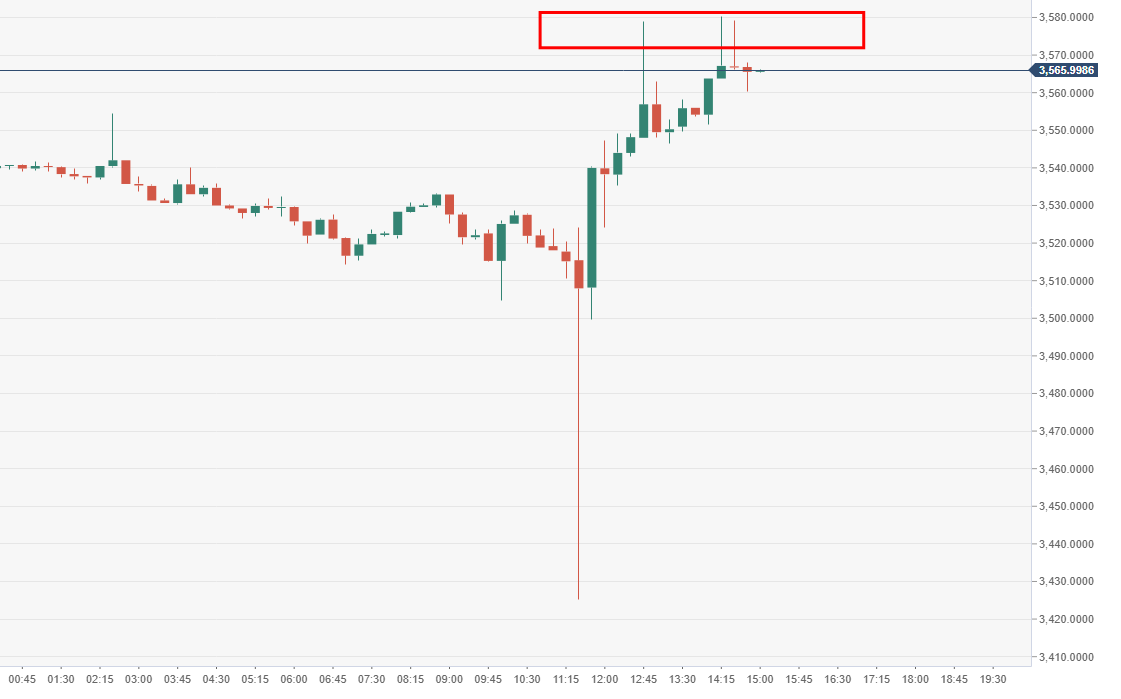
Spot rate: 3574.55
Relative change: +1.45%
High: 3580.39
Low: 3425.33
Trend: Neutral
Support 1: 3493.06, daily pivot point support.
Support 2: 3454.03, daily pivot point support.
Support 3: 3418.24, daily pivot point support.
Resistance 1: 3567.88, daily pivot point resistance.
Resistance 2: 3603.67, daily pivot point resistance.
Resistance 3: 3642.7, daily pivot point resistance.
- BTC/USD pressing towards a breakout of this extremely narrow two-day range.
BTC/USD 60-minute chart
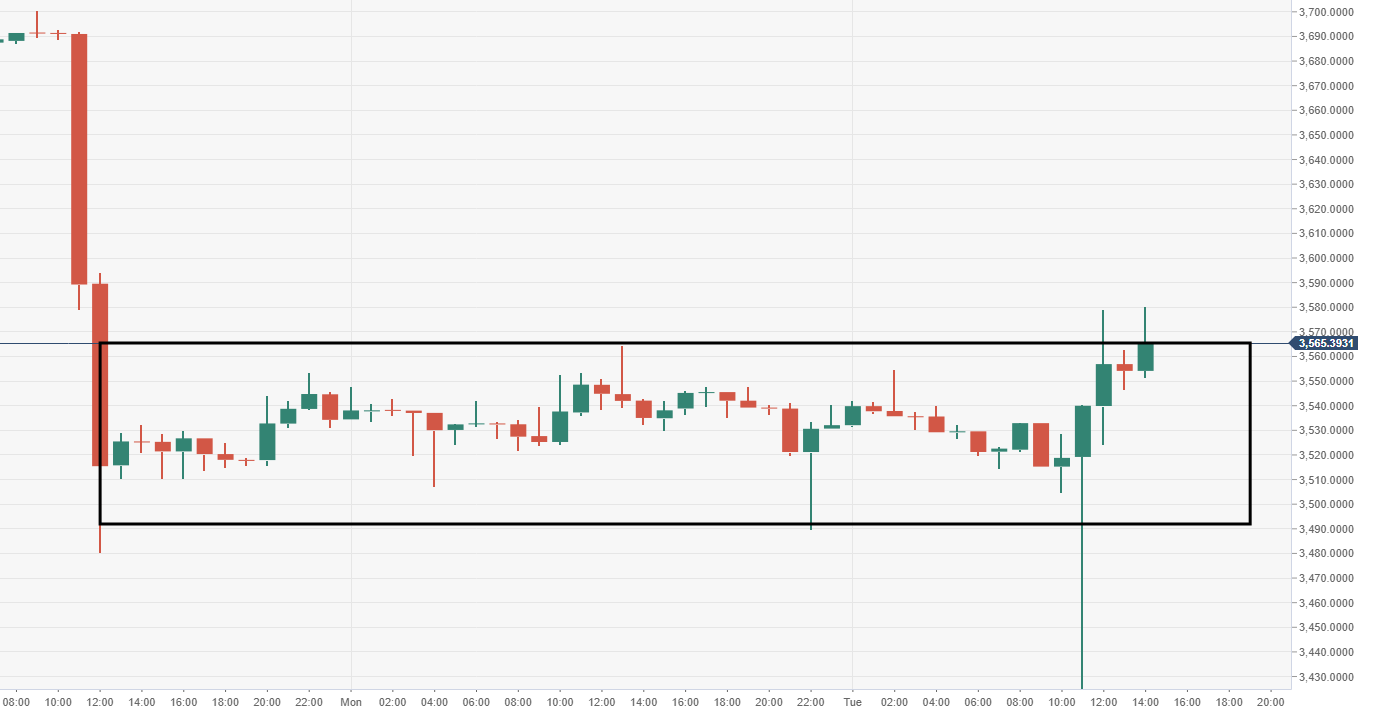
- It did at one point today look as though the price was going to crash out of the range-block formation. This would be triggered a potentially new bearish trend.
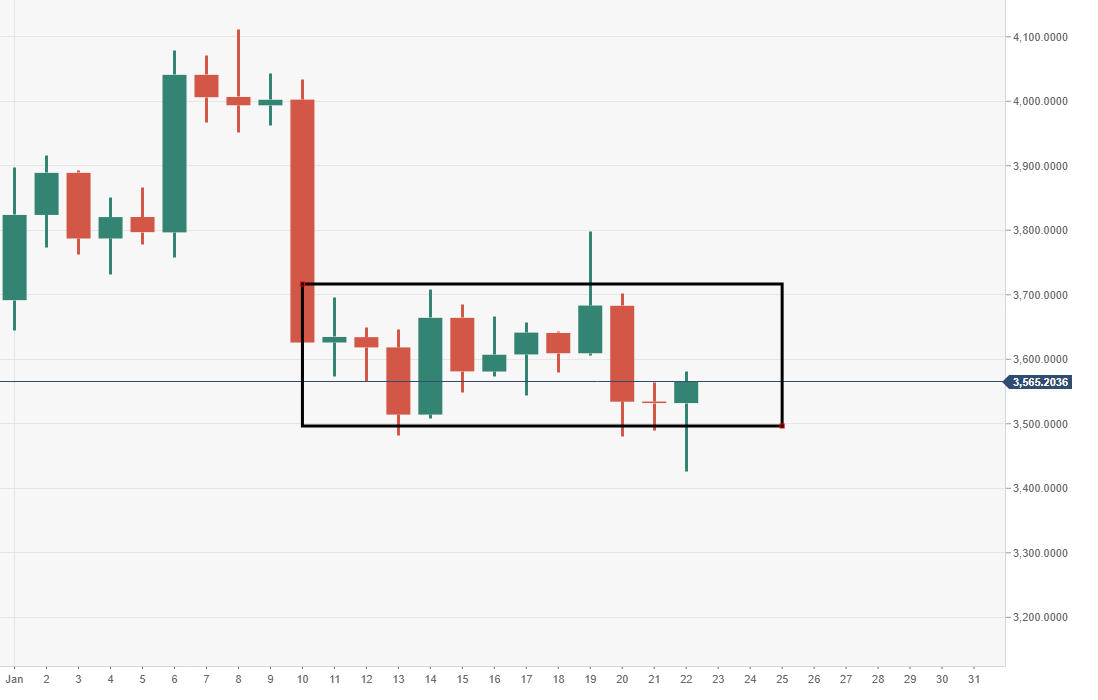
BTC/USD daily chart
Author

Ken Chigbo
Independent Analyst
Ken has over 8 years exposure to the financial markets. He started his career as an analyst, covering a variety of asset classes; forex, fixed income, commodities and equities.


