Bitcoin Technical Analysis: BTC/USD going through a very strange period of trading
- Bitcoin price on has return to normality, trading with minor 1% losses, after the wild swings on Monday.
- BTC/USD has moved back within the range prior to the spike on Monday. Moving within $6400-6600 zones.
- Large volatility seen over the past few days; no thanks to the Tether 'stablecoin' panic. Elsewhere, Bitcoin receiving a bashing from globally known economic Roubini, calling it a 'mother of all scams'.
- Caution is so high across the market, pariticpants are unsure of what direction to committ to.

BTC/USD 60-minute chart
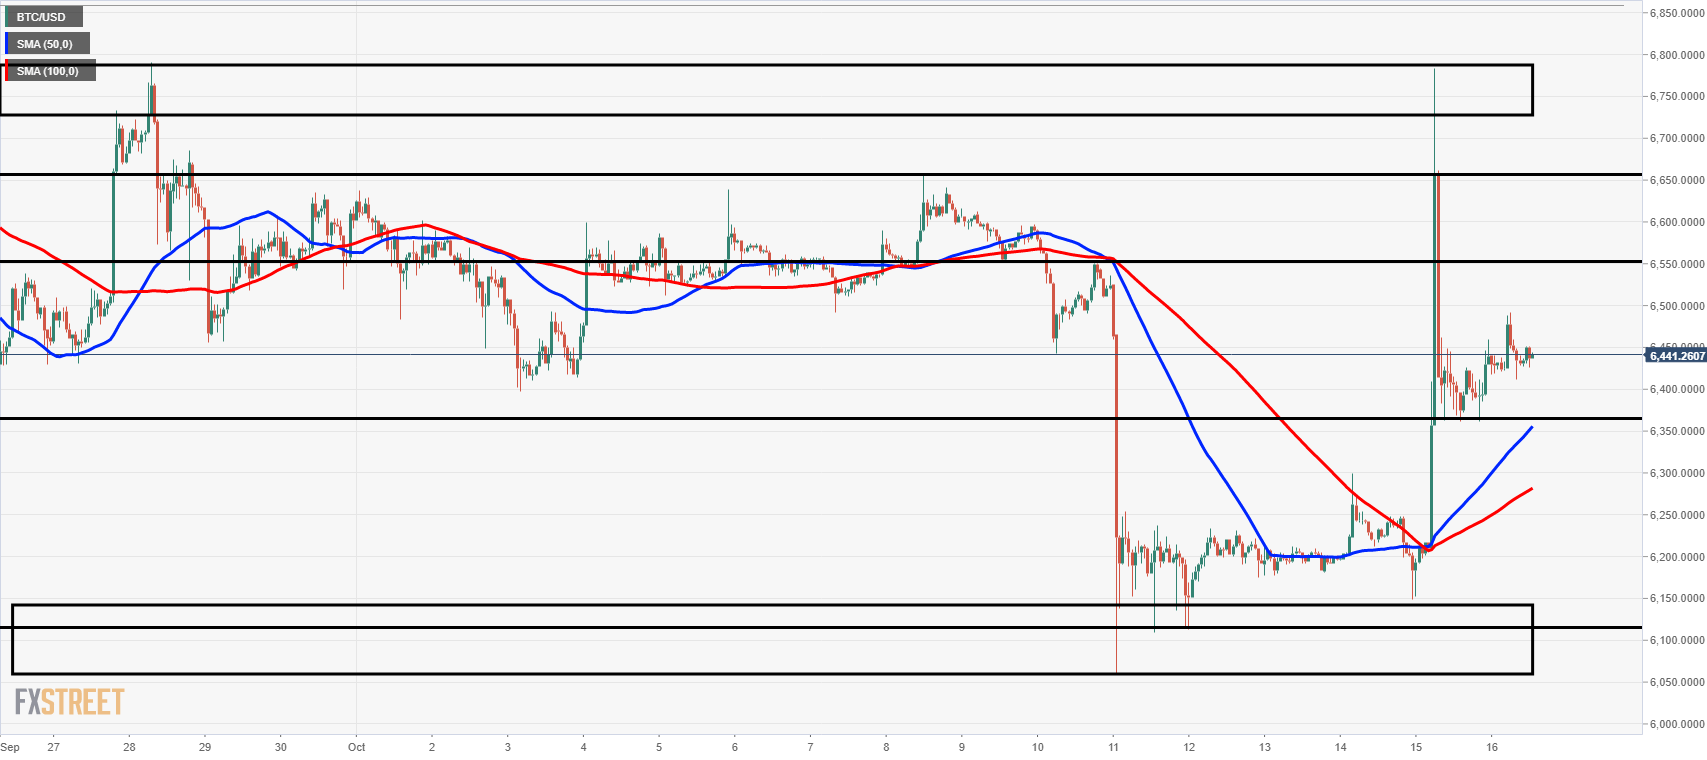
Spot rate: 6590.82
Relative change: +4.65%
High: 6673.9
Low: 6589.49
Trend: Neutral/Bearish
Resistance 1: 6600.0, upper part of supply zone.
Resistance 2: 6655.5, resistance on 60-minute chart.
Resistance 3: 6791.0, 28 September high.
Support 1: 6366.0, support on 60-minute chart.
Support 2: 6150.0, demand area.
Support 3: 6060.0, long wick low 11 October.
Author

Ken Chigbo
Independent Analyst
Ken has over 8 years exposure to the financial markets. He started his career as an analyst, covering a variety of asset classes; forex, fixed income, commodities and equities.


