Bitcoin Technical Analysis: BTC/USD bulls may not see $4000 for a while, without breakout of daily range
- Bitcoin on Wednesday is trading in minor positive territory, holding gains of just some 1.7%.
- BTC/USD still has vulnerabilities to downside risks, with price moving within dangerous range block formation via the daily.

BTC/USD 15-minute chart
- Near-term supply can be seen heading into the $3700 price region.
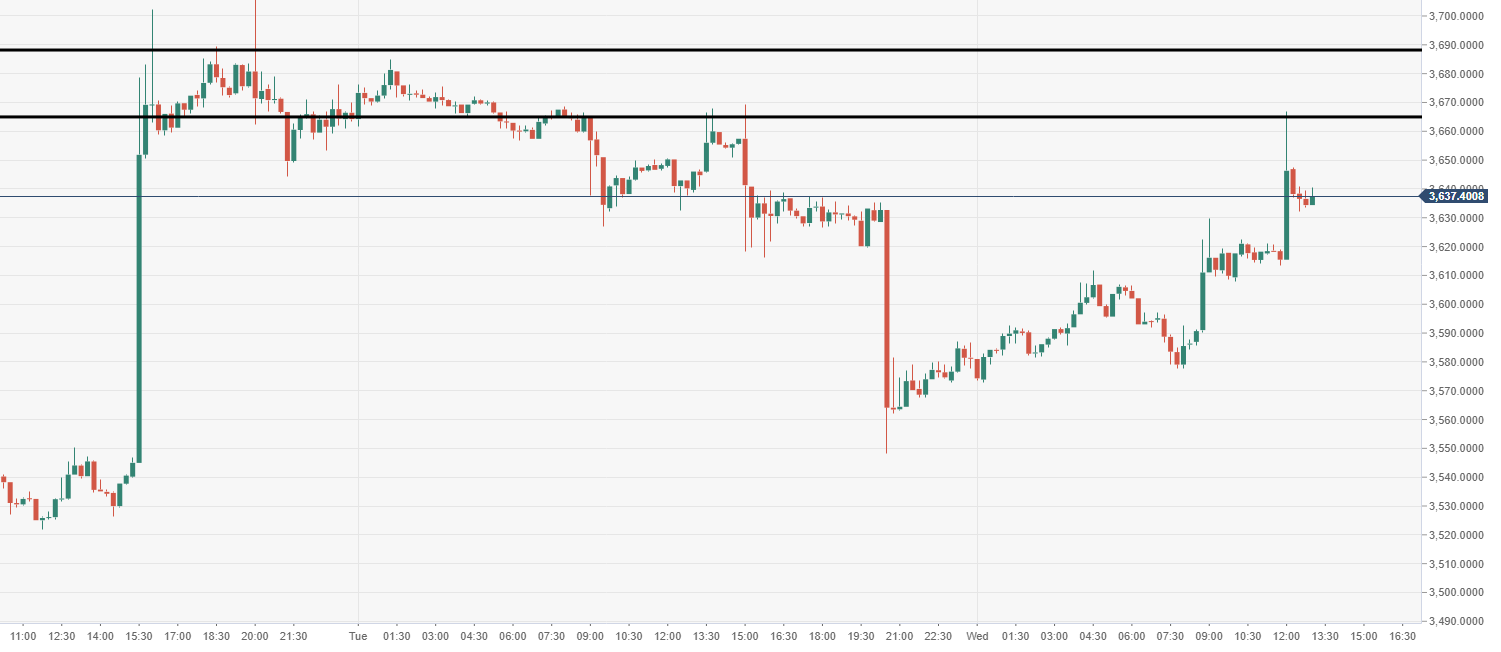
Spot rate: 3639.0
Relative change: +1.75%
High: 3640.4
Low: 3572.8
Trend: Bullish
Support 1: 3524.62, daily pivot point support.
Support 2: 3468.02, daily pivot point support.
Support 3: 3387.91, daily pivot point support.
Resistance 1: 3661.32, daily pivot point resistance.
Resistance 2: 3741.42, daily pivot point resistance.
Resistance 3: 3798.02, daily pivot point resistance.
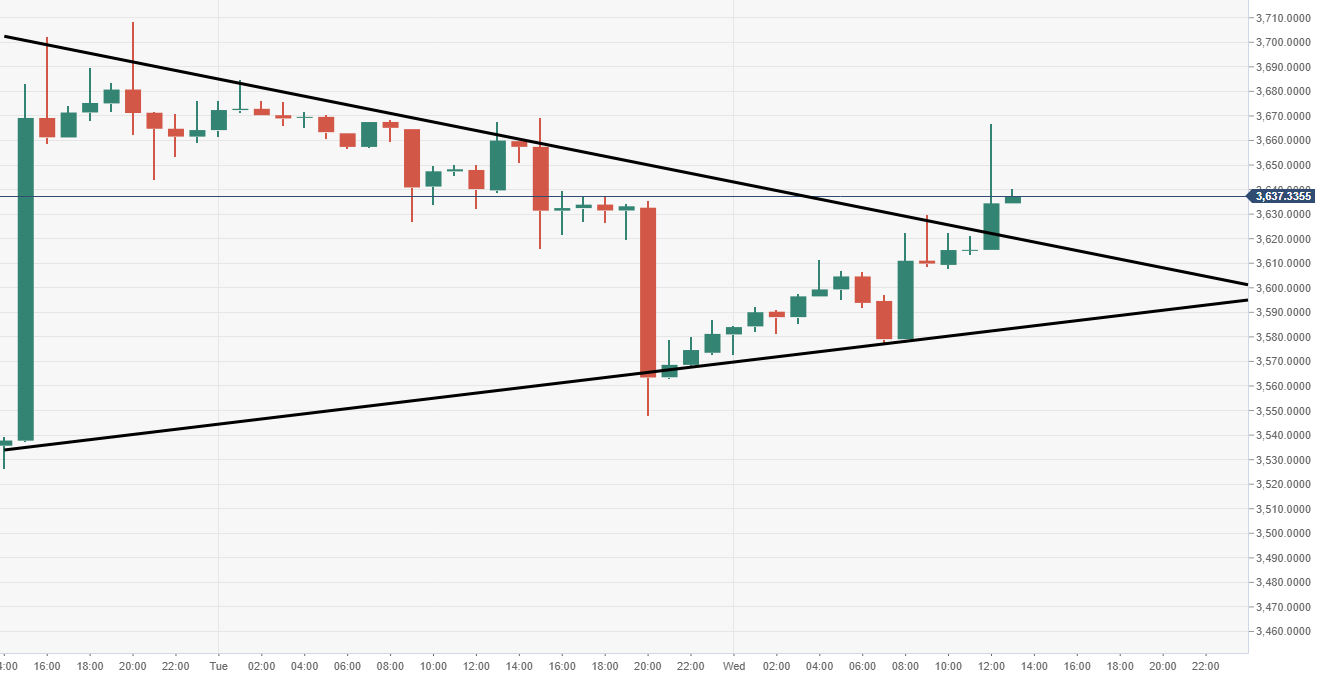
BTC/USD 60-minute chart
- Price makes a breakout to the upside from a triangular pattern structure, hourly candle closure seen above.
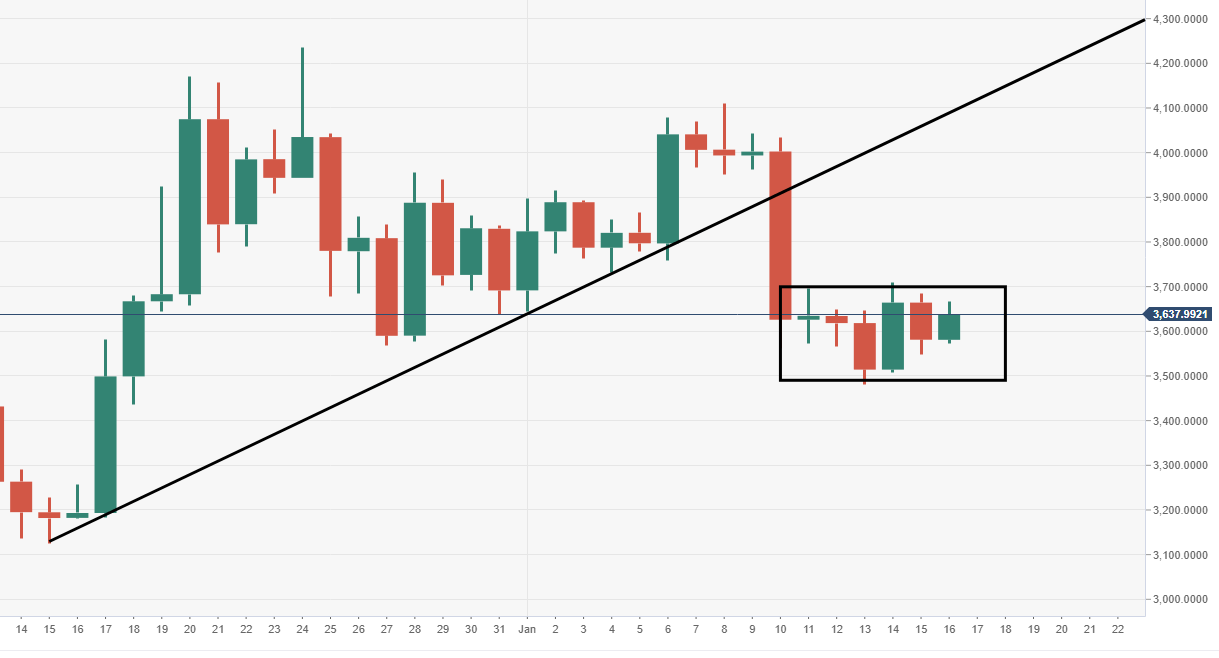
BTC/USD daily chart
- Price action continues to be stuck in a mundane narrowing daily range.
Author

Ken Chigbo
Independent Analyst
Ken has over 8 years exposure to the financial markets. He started his career as an analyst, covering a variety of asset classes; forex, fixed income, commodities and equities.


