Bitcoin Price Prediction: These on-chain metrics suggest bears are underwater
- Bitcoin hovers above the $20,000 level following the recent Fed-hike announcement.
- On-chain metrics show bears are already underwater and may still need to capitulate.
- Invalidation of the bullish thesis is a breach below $19,610.

Bitcoin price is at a make-or-break decision. Currently, the peer-to-peer digital currency is hovering above a key level. If market conditions persist, bulls may be able to pull off another rally going into the new year.
Bitcoin price shows bears underwater
Bitcoin is finding support above the previous triangle apex near the $20,300 price level. On November 2, the bulls lost support from the 8-day exponential moving average following the Fed-hike announcement. Although nothing is certain, BTC’s ability to sustain above the previous congestion zone is an optimistic signal that BTC may be able to dodge inflation’s depreciating effects on the economy.
Bitcoin price currently auctions at $20,305. The Relative Strength Index (RSI) shows a bearish divergence between the last two highs, which likely enticed bears to flex their power following the Fed monetary policy announcement. Still, it is very rare for the RSI to top on the first bearish divergence signal. If the bulls can stabilize in this zone, a challenge of the last-minute October highs at $21,000 will stand a fair chance of occurring.
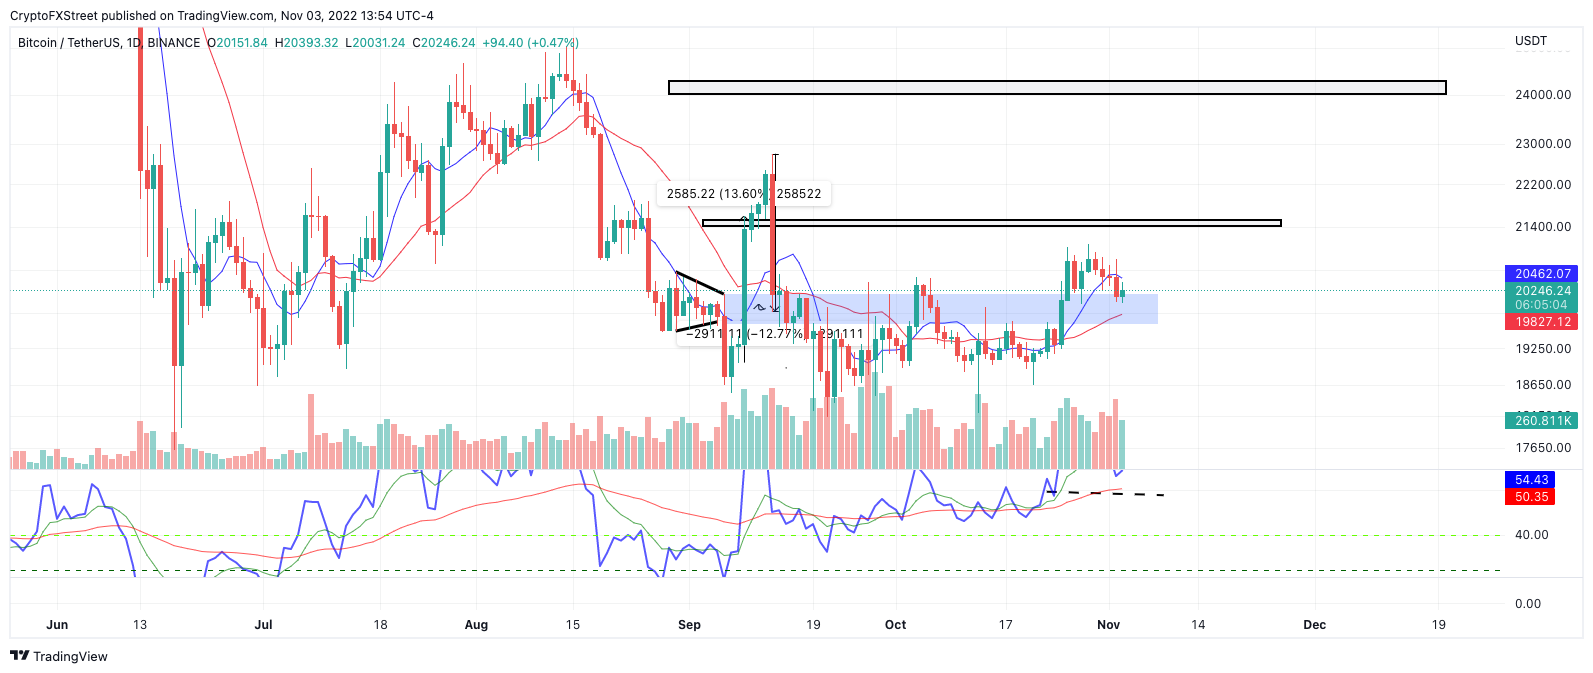
BTC/USDT 1-Day Chart
Coinglass’ Long vs. Short Ratio compounds the idea that the bears may soon face a challenge, as the last week of October shows most retail traders positioned short in the market. Nearly six of every ten traders were positioned short on October 24, when BTC traded between 19,602 and 19,157, and October 31, when BTC traded between $20,845 and $20,237. Market makers may use this evidence to challenge bears underwater by moving the market higher to forge a liquidation event. Short-term targets lie at $20,500, while a $24,300 level may be a Santa Rally target zone.

Coinglass’s Long vs. Short Ratio
Invalidation of the bullish thesis is possible if the bears breach the $19,610 level. The breach could result in a further decline toward liquidity levels near $18,700. Such a move would create a 7% decrease from the current Bitcoin price.
In the following video, our analysts deep dive into the price action of Bitcoin, analyzing key levels of interest in the market. -FXStreet Team
Author

Tony M.
FXStreet Contributor
Tony Montpeirous began investing in cryptocurrencies in 2017. His trading style incorporates Elliot Wave, Auction Market Theory, Fibonacci and price action as the cornerstone of his technical analysis.