Bitcoin Price Prediction: BTC/USD locked in a range amid low trading activity — Confluence Detector
- BTC/USD bulls struggle to push above $11,500.
- The support of $11,300 will slow down the bears.

Bitcoin (BTC) has been range-bound below $11,500 since the middle of the week. A cluster of technical barriers prevents the price from moving upwards towards the next critical resistance created by $12,000. At the time of writing, BTC/USD is changing hands at $11,440, having recovered from the intraday low of $11,281. The coin is mostly unchanged both on a day-to-day basis and since the beginning of the day.
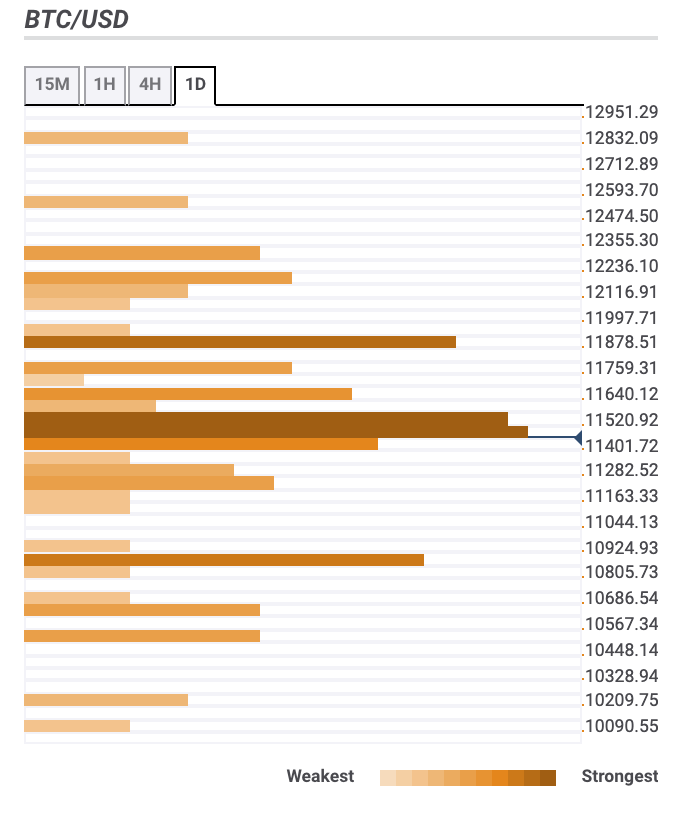
BTC/USD daily chart
-637342167870108014.png)
On the intraday charts, BTC/USD dropped below 1-hour SMA100 and headed to $11,400. If this barrier is passed, $11,300 will come int focus. This support should slow down the bears for the time being. However, once it is broken, the sell-off may be extended to $11,250, which is the lowest level of the week. On the upside, a sustainable move above $11,500 is needed for the recovery to gain traction.
Bitcoin confluence levels
The vast majority of technical barriers are clustered both above the current price, which means the price may spend some more time in a current range. Let's have a closer look at support and resistance levels for BTC/USD.
Resistance levels
$11,500 - 4-hour SMA200, the middle line of the 4-hour Bollinger Band, and the upper line of the 1-hour Bollinger Band
$11,850 - 38.2% Fibo retracement weekly, Pivot Point 1-day Resistance 2
$12,100 - the upper line of the daily Bollinger Band, 61.8% Fibo retracement weekly
$12,200 - the upper line of the daily Bollinger Band, Pivot Point 1-week Resistance 2
Support levels
$11,400 - the middle line of the 1-hour Bollinger Band, 1-hour SMA50
$11,200 - the lower lines of the 4-hour and 1-hour Bollinger Bands
$10,800 - Pivot Point 1-week Support 2, 23.6% Fibo retracement monthly
BTC/USD, 1-day

Author

Tanya Abrosimova
Independent Analyst


