Bitcoin Price Prediction: BTC slips into “Buy the Dip” Zone
- Glassnode’s SOPR index presents a “Buy the Dip” signal following Bitcoin’s recent slide to $10,300.
- IntoTheBlock IOMAP highlights intense selling pressure towards $11,000.

Bitcoin recently encountered an expected resistance under $11,200 on the run-up to $12,000. A reversal ensued, initially finding support at $10,800. Attempts to recover the lost ground and close the week above $11,000 failed amid exhaustion in the bullish camp. On the other hand, bearish positions increased on Monday, culminating in a breakdown to $10,300.
Glassnode’s Spent Output Profit Ratio (SOPR) enters “Buy the Dip” territory
On-chain data is gradually becoming a fundamental factor in the cryptocurrency market. Traders are employing different on-chain metrics to predict market trends and capitalize on both upswings and downswings. The SOPR indicator by Glassnode, a renowned provider of on-chain insights, assists in understanding the economics within Bitcoin’s ecosystem. The index brings to light instances when the average stakeholder is either at a profit or a loss. According to Glassnode:
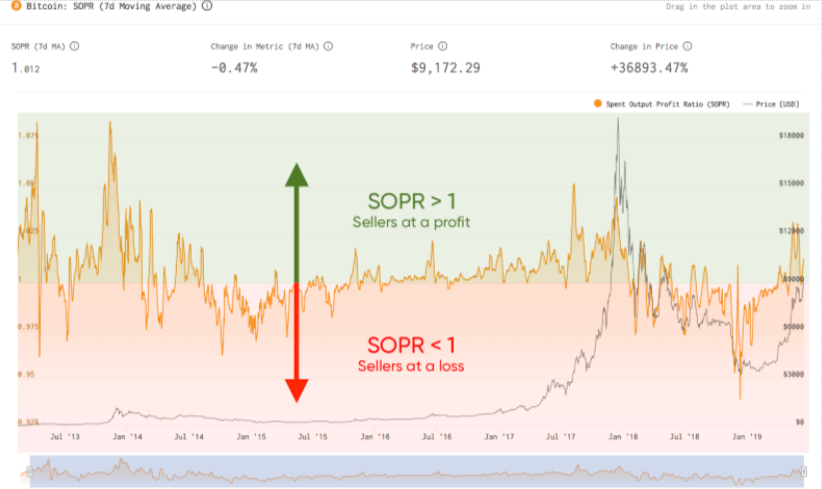
SOPR represents the profit ratio of coins moved on-chain, measured through the variation between the purchase price and sale price. It is calculated by dividing the realized value of a spent output (in USD) by the value at creation (in USD).
Therefore, a SOPR value of more than one suggests that stakeholders are selling at a profit, on average. In other words, the price sold surpasses the price paid for the coins. Subsequently, a SOPR value of less than one suggests that stakeholders are selling at a loss.
BTC SOPR chart
The SOPR index explained
The SOPR tracks both bullish and bear markets. Traders need to know that the market tends to reverse quickly during bull runs, in turn, pushing the SOPR value below one. It also means that most people are selling at a loss. On the flip side, during breakdowns, markets tend to reverse, pushing the SOPR value above one (these are the prices where profits are being encountered). In other words, stakeholders get anxious that prices will continue to fall; for this reason, they sell at break-even points.
According to Philip Swift, the co-founder of Decentralized.com, the SOPR index presents a “buy the dip opportunity.” As explained before, the SOPR is falling below one, and during bulls markets, this could be an excellent time to buy. However, informed traders would have to support this idea with key fundamental levels and technical analysis before diving to “Buy the Dip.”
Spent output profit ratio (SOPR) is dipping below one right now.
— Philip Swift (@PositiveCrypto) September 22, 2020
In bull markets this is a buy the dip opportunity.
I believe there is sufficient technical and fundamental evidence to suggest we are in the early stages of a bull market right now. pic.twitter.com/ji1P54iR1F
Looking at the daily range, BTC/USD is trading within a symmetrical triangle pattern. Breakouts and breakdowns are likely in these types of chart patterns. Therefore, if Bitcoin bulls hold above $10,400 (short-term support), a push for gains towards $11,000 could eventually confirm a breakout. A close above last week’s resistance at $11,200 would pave the way for advancements targeting $12,000. The Relative Strength Index seems to be stabilizing above 40, while a return to levels above the midline would mark the beginning of upward price action.
BTC/USD daily chart
 (35)-637364511140790370.png)
Not much can be said about the weekly chart. However, if the descending wedge pattern is confirmed, a breakout would ensue, sending Bitcoin towards $12,000. Simultaneously, if the pattern leads to a bull flag, Bitcoin could still break out, targeting $12,000. Moreover, the Moving Average Convergence Divergence (MACD) is holding well in the positive territory, highlighting buying pressure.
BTC/USD weekly chart
 (34)-637364506574762381.png)
IntoTheBlock’s IOMAP model shows high congestion of sellers between $10,466 and $10,775. Here, 1.22 million addresses previously purchased 1.01 million BTC. It will not be easy to bypass this supply zone; hence Bitcoin may start a reversal to the most formidable support between $9,520 and $9,829, an area where 1.12 million addresses bought about 750,000 BTC. In
BTC IOMAP chart
-637364508281173274.png)
Looking at the other side of the fence
It is worth mentioning that although a recovery took place immediately after the dip to $10,300, the flagship cryptocurrency stalled marginally below the 50 Simple Moving Average (SMA) in the hourly range ($10,600). Another bearish correction from the hurdle appears to be confirming a bear flag pattern, likely to send BTC back to $10,300.
BTC/USD hour chart
 (33)-637364507297818159.png)
The extent of the ongoing bearish leg cannot be determined at the moment; we will have to wait to see it play out. However, the IOMAP model has already highlighted more resistance to $11,000. On the downside, significant support can only be found in the range between $9,520 and $9,829.
Author

John Isige
FXStreet
John Isige is a seasoned cryptocurrency journalist and markets analyst committed to delivering high-quality, actionable insights tailored to traders, investors, and crypto enthusiasts. He enjoys deep dives into emerging Web3 tren


