Bitcoin Price Forecast: BTC lacks healthy support levels on the downside – Confluence Detector
- BTC difficulty has reached all-time high levels.
- The daily price chart is presently consolidating below the SMA 20 curve.

Bitcoin difficulty levels have reached all-time high levels of 19.315 T. Difficulty is a metric that determines how tough mining the protocol currently is. Usually, the difficulty increases when there is a lot of mining activity within the network. This makes sure that consistency in block production is maintained.
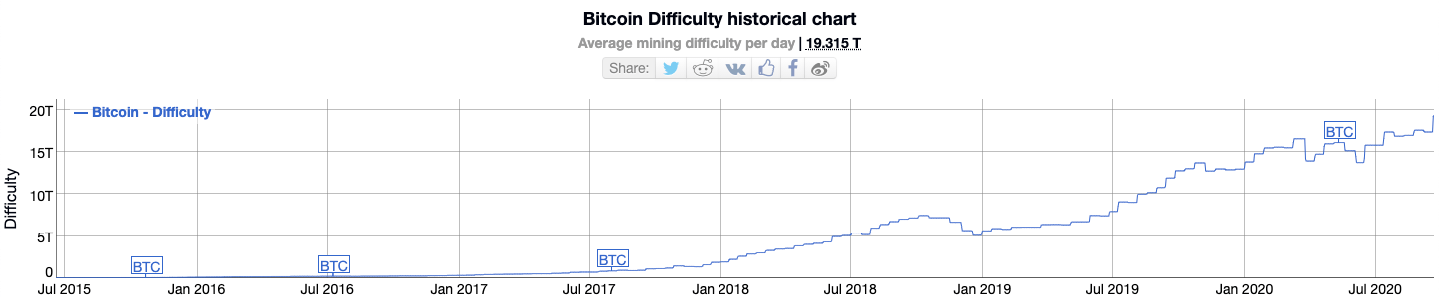
A jump in difficulty usually follows a jump in the overall network hashrate.
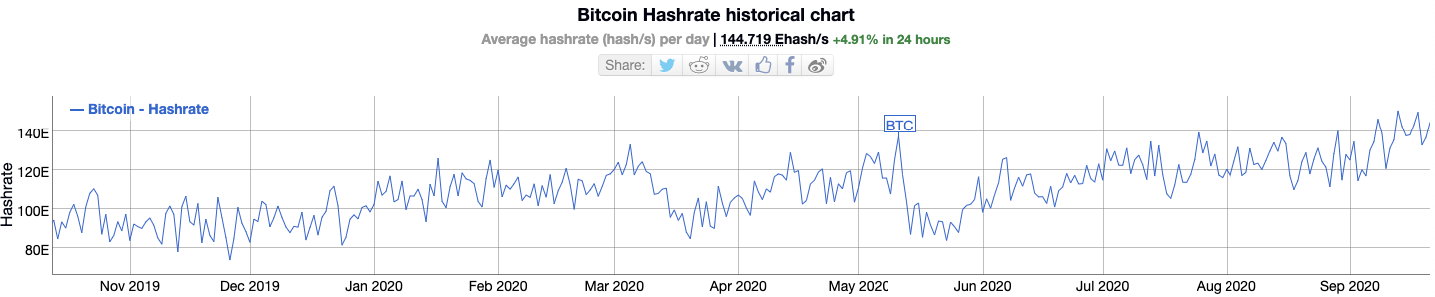
Bitcoin’s hashrate is also trending around all-time high levels - above 140 Ehash/s. Hashrate is the overall computational power of the whole network. Higher the hashrate, the higher the overall speed and security of the Bitcoin network.
Usually, a high hashrate is a bullish sign; however, things haven’t really turned out that way.
BTC/USD daily chart
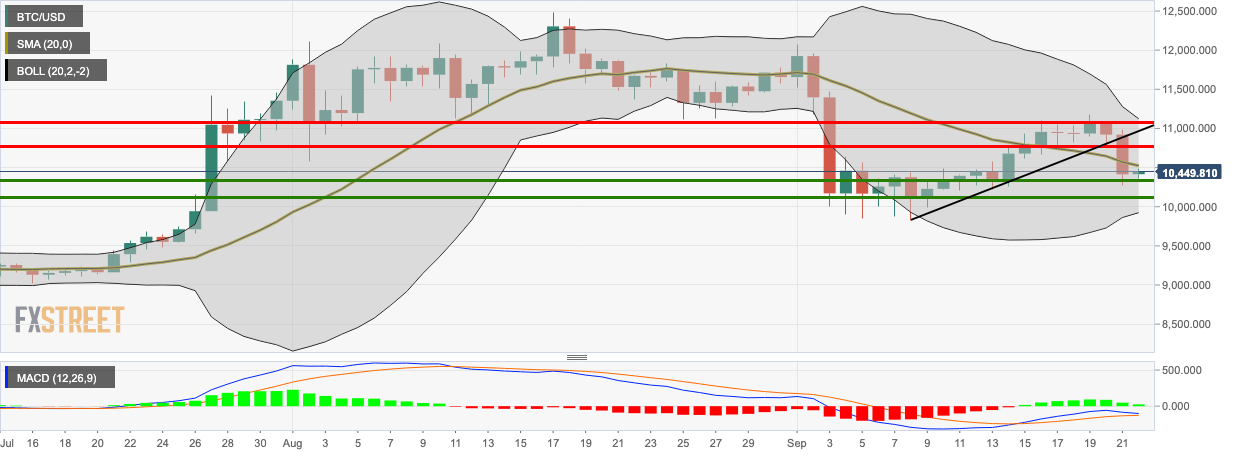
BTC encountered resistance at $11,075, after which it dropped to $10,415 over the next two days. In the process, it fell below the ascending triangle and the SMA 20 curve. Since then, the price has risen to $10,475 in the early hours of Tuesday. The 20-day Bollinger Jaw is constricting, which hints at decreasing price volatility. This shows that the price has entered a period of consolidation following the recent bearish action.
The MACD shows that the bullish momentum has been steadily decreasing. For the bulls to regain their momentum, they must take the price up to $10,525 to cross above the SMA 20 curve. However, how much is the premier cryptocurrency’s upside potential? For that, we need to look at the daily confluence detector.
BTC daily confluence detector
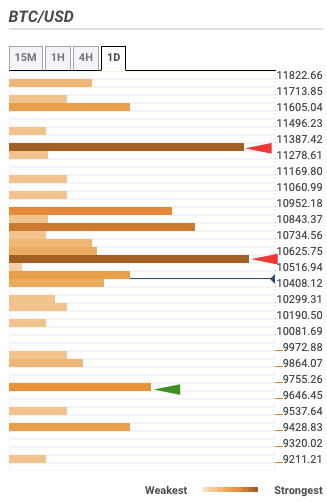
It looks like we have the upside capped off at $10,600, which has the one-day Bollinger Band middle curve, one-day 38.2% and one-week 61.8% Fibonacci retracement levels. After that, the next strong resistance level is at $11,300, highlighted by the one-day Bollinger Band upper curve, daily Pivot Point one resistance-two, weekly Pivot Point one resistance-one and one-month Fibonacci 61.8% retracement level.
On the downside, there is a moderate resistance level at $9,700, which has the monthly Pivot Point one support-two and weekly Fibonacci 161.8% retracement level.
Author

Rajarshi Mitra
Independent Analyst
Rajarshi entered the blockchain space in 2016. He is a blockchain researcher who has worked for Blockgeeks and has done research work for several ICOs. He gets regularly invited to give talks on the blockchain technology and cryptocurrencies.




