Top 3 Coins Price Prediction Bitcoin, Ethereum and Ripple: Market crumbles under bearish pressure
- More than 83,400 Bitcoin options will expire on 25th September.
- Analyst Alex Krüger said that Ethereum is struggling to handle its expanding DeFi user base.
- Ripple co-founder Jed McCaleb has recently cashed out 11.4 million XRP (nearly $3 million).

Bitcoin
Over 83.4K Bitcoin options to expire this week
More than 83,400 Bitcoin options will expire on 25th September, according to Skew. This is a much higher number compared to the 62,000 BTC options that expired in August.
80k $BTC options expiring next week Friday pic.twitter.com/B4Y0x4dez8
— Unfolded (@cryptounfolded) September 18, 2020
With such a high number of BTC options and CME Bitcoin futures expiring on the same date, Bitcoin volatility is likely to surge in the coming week. The daily BTC/USDT chart provides the necessary information to determine the direction of the volatility.
BTC/USD daily chart

BTC/USD had a bearish breakout from an inverse cup and handle pattern. The price has dropped from $10,920 to $10,480. In the process, the price has broken below the SMA 20 curve. The last time the price broke below the SMA 20, the price had a catastrophic downtrend, plummeting from $11,925 to $10,180. As of now, it looks like the price is going to drop further to the $10,165 support line.
BTC IOMAP

IntoTheBlock’s “In/Out of the Money Around Price” (IOMAP) model estimates that the premier cryptocurrency is still sandwiched between strong resistance and support walls despite the downtrend. As of now, the $10,300 support plays a crucial role in Bitcoin’s trend as it is the most immediate support level under the price. Previously, 1.19 million addresses had purchased a little over half a million BTC. This level may absorb some of the selling pressure; however, it looks like the bears should be able to break below it. Following that, the price has room to fall to $9,700 before it meets the next healthy support wall.
On the upside, the price has a strong resistance level at $10,600. In this zone, nearly 750k addresses had bought a little less than 700,000 BTC. Seeing the levels, we are dealing with here. The odds are favoring a downward trend.
BTC on-chain
Aged Consumed
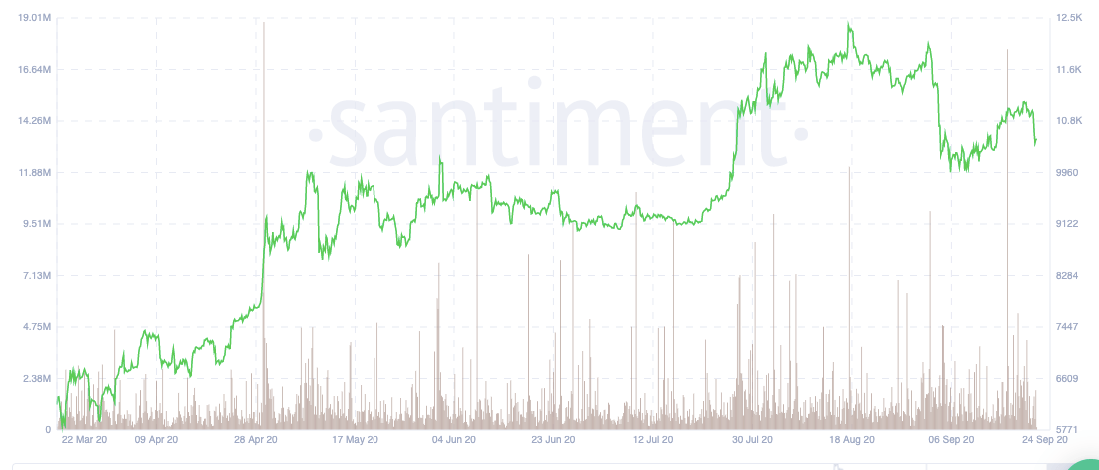
Santiment’s “Aged Consumed” chart is a helpful metric to help us understand sharp price movements. As you can see, on 29th April, there was a huge spike, wherein the price jumped from $8,670 to $9,450 over the next ten days. The next comparable spike has happened recently on 16th September, which has triggered the present downward movement.
Ethereum
Ethereum is not able to keep up with the DeFi demand – Analyst
Owing to the ongoing craze in the DeFi space, around 114,000 users are currently using Ethereum. According to Alex Krüger, a global markets analyst, the blockchain cannot keep up with the rising demand for DeFi.
The total value locked (TVL) in DeFi protocols has surged from $1.882 billion to $9.35 billion since July 1. Uniswap protocol alone has $1.81 billion locked on its platform. Meanwhile, Ethereum fees are skyrocketing and the network’s user activity is nearing all-time high levels. The Ethereum ecosystem and the open-source developer community did not expect the DeFi space to grow at this exponential pace.
Krüger recently questioned whether ETH 2.0 would be able to keep up with the rapid growth of DeFi.
Assuming DeFi users have four addreses on average (could be more), there are now 114K users. Small number with massive room for growth. For comparison, Coinbase has 32M users.
— Alex Krüger (@krugermacro) September 18, 2020
But Ethereum can't handle 114K users. Will Ethereum 2.0 be able to handle millions of users? How many? pic.twitter.com/ayVMLtjowT
ETH 2.0 is expected to provide Ethereum with the scalability that it needs to support DeFi. A few months back, Ethereum co-creator Vitalik Buterin said ETH 2.0 would process 100,000 transactions per second (TPS) over the long run.
ETH2 scaling for data will be available *before* ETH2 scaling for general computation. This implies that rollups will be the dominant scaling paradigm for at least a couple of years: first ~2-3k TPS with eth1 as data layer, then ~100k TPS with eth2 (phase 1). Adjust accordingly.
— vitalik.eth (@VitalikButerin) June 30, 2020
Krüger noted that it would be crucial for ETH 2.0 to handle many active users to ensure demand for DeFi does not overrun Ethereum.
DeFi is still in its infancy, Diginex CEO
In a recent interview with Anthony Pompliano, Richard Byworth, the CEO of Diginex, shared his thoughts on the ongoing boom in DeFi. According to Byworth, the DeFi space is still in its infancy.
It's like trying to fly to the moon in a cardboard box — I mean, you're going to get yourself into trouble along the way, and, you know, things are going to break and burn up, as we've already started to see.
Byworth noted that inconsistency does not look good to those who are just newly entering the cryptocurrency space. The CEO recalled that the digital asset industry reached peak bubble status in 2017 due to the rising trend of initial coin offerings (ICOs). The trend was later stomped out by regulation. In recent weeks, DeFi has given off similar vibes, with many random assets spiking in price, as per Byworth.
I definitely look back to 2017, and this DeFi thing is probably not what we need right now. We've got MicroStrategy coming in, we've got Paul Tudor Jones coming in, we've got some really serious hitters starting to pay attention to this industry and I just hope that DeFi doesn't become another ICO craze that people go, 'you know what, everyone's crazy in crypto,' and stay away from it for another few years.
Byworth is also not the only one to compare the DeFi sector to ICOs in 2017. The founder of digital asset data site Messari, Ryan Selkis, also recently expressed similar thoughts.
ETH/USD daily chart

ETH/USD has had a bearish breakout from the triangle formation as the price dropped from $371 to $345. Over the last four days, the bears have pretty much managed to negate the gains made by the bulls between 6th-17th September. The MACD has reversed from bullish to bearish, so further price drop is expected. However, how far is the price going to drop? For that, we need to look at the IOMAP.
ETH IOMAP

So, it looks like healthy support walls do not support the price. As of now, the bears can drop all the way to $290 before it meets a weak-moderate support wall. Hence further decline is expected since none of the levels can withstand intense selling pressure.
However, while it seems unlikely, if the buyers somehow regain control, they have a clear path to go up till $375 before encountering a strong resistance wall.
ETH on-chain
Holder distribution

As per Santiment’s holder distribution chart, holders in the 10,000-100,000, 100,000-1,000,000, and 1,000,000-10,000,000 zones have all sold off their coins. This shows that over the last 4-5 days, the selling pressure behind the smart contract platform has increased quite a bit.
Ripple
Ripple co-founder cashes out another 11.4M XRP
Ripple co-founder Jed McCaleb has cashed out another portion of his XRP holdings. Data by XRPL Monitor shows that the former CTO has cashed out 11.4 million XRP (nearly $3 million). Meanwhile, the coin’s liquidity indexes have not reached new all-time highs in a long time.
Some community members believe that McCaleb’s frequent XRP dumps may cause bearish pressure on the coin’s exchange rate. According to Liquidity Index Bot data, the XRP liquidity indexes on four ODL corridors have been low for a while now. These indexes include Bitso, Bitstamp, BTC Markets and Coins.ph.
A U.Today report noted that since the Black Thursday (March 12), the liquidity indexes of XRP have been unable to print new all-time highs. Meantime, Ripple is expanding its ODL network and plans to set up some more ODL corridors this year – in Asia, Africa and Latin America.
XRP/USD daily chart
-637363329529324439.png)
XRP/USD has consistently failed to break above the SMA 20 curve over the last four days and has dipped below the flag formation. As of now, it looks like the price is going to drop to the $0.227 support level. However, there is some good news. The William’s %R has fallen into the overbought zone, showing that XRP may soon enjoy a bullish correction.
As previously reported, Ripple could be looking for a correction down to $0.21.
Key levels
Author

Rajarshi Mitra
Independent Analyst
Rajarshi entered the blockchain space in 2016. He is a blockchain researcher who has worked for Blockgeeks and has done research work for several ICOs. He gets regularly invited to give talks on the blockchain technology and cryptocurrencies.


