Bitcoin price facing final resistance before $68K?

Bitcoin is very close to new all-time highs once again but the final hurdle may take some time to overcome.
Bitcoin’s (BTC) price has so far failed to make new all-time highs above $60,000 this week. After the breakout above $58,000, negative news from India, as well as general macroeconomic weakness and rebounding U.S. dollar, appear to have halted the rally.
This resulted in a pullback toward $53,000 on March 16. Such a move is normal as the bull market typically moves in waves. In other words, the market will find a new equilibrium of buyers and sellers, after which it will decide where to go next.
Overall, the market has been in a significant uptrend as Bitcoin’s price has accelerated from $11,000 to $60,000 in just six months.
Bitcoin fails to break $60,000
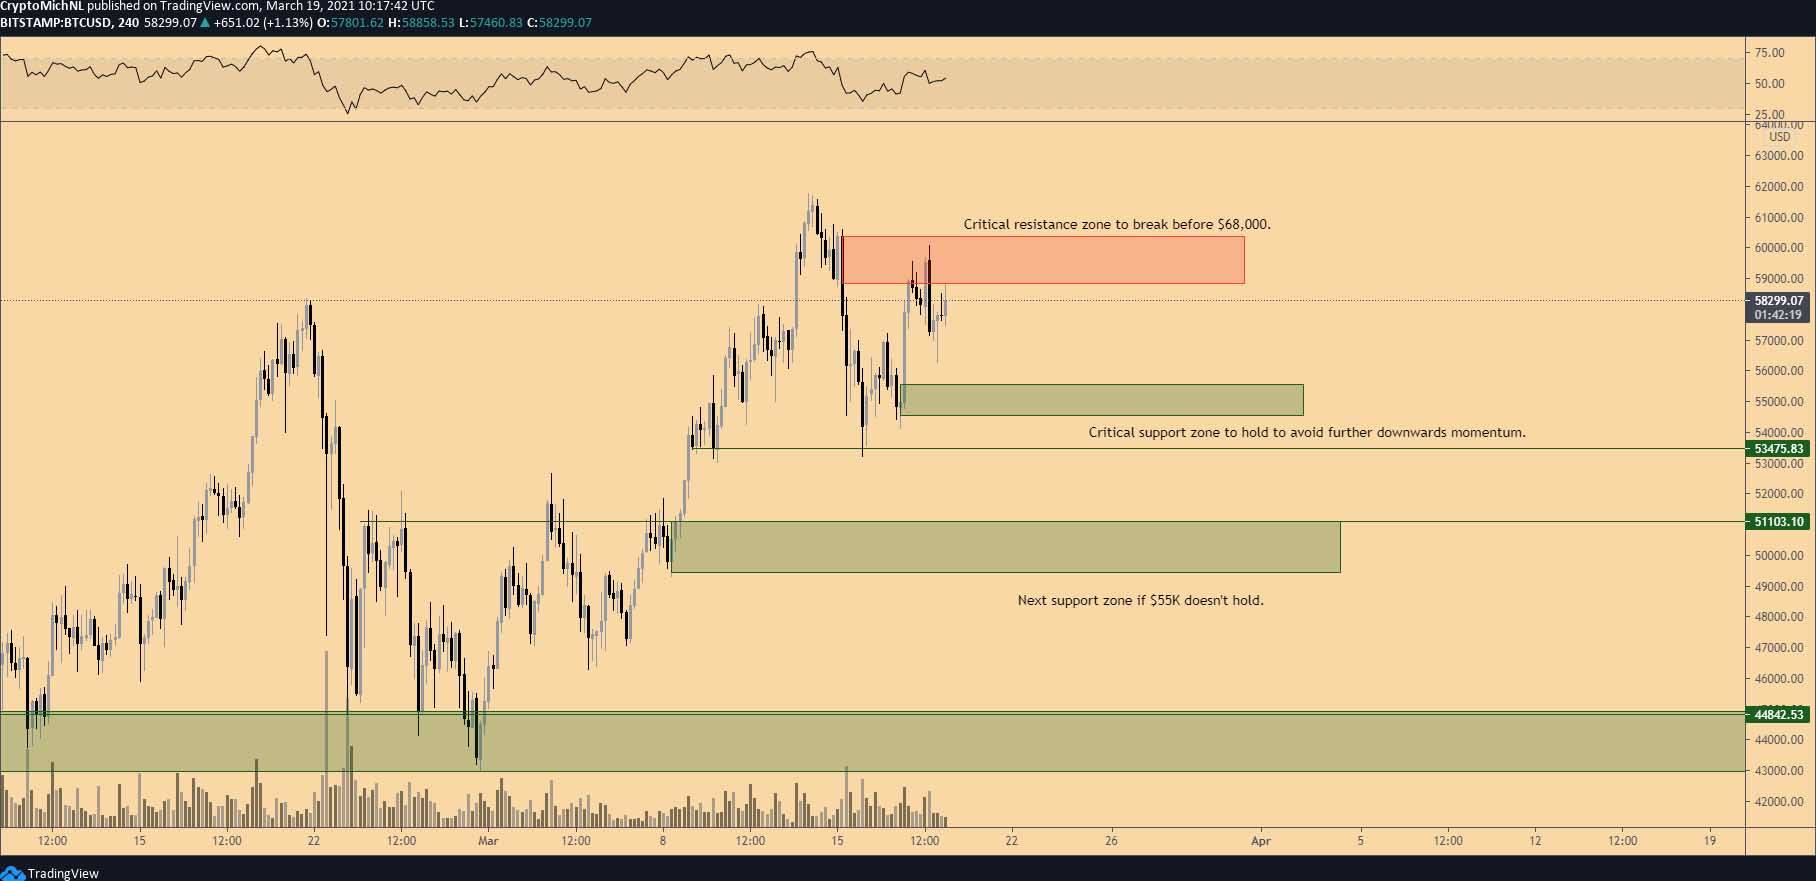
BTC/USD 4-hour chart. Source: TradingView
The 4-hour chart shows apparent support at $53,000, which held once again. The subsequent continuation upward is seen on the 4-hour chart of Bitcoin.
This upward continuation then met the next big resistance at $58,800-$60,000. This is the final key resistance level before the next impulse wave toward $68,000 can happen.
However, Bitcoin’s price couldn’t break through this resistance zone yesterday, which has pushed it back toward its previous range. The top of this range is $58,800-60,000 while the bottom support area is at $54,000-$55,000 and $53,000.
The pressure will likely see a build-up resulting in a breakout to the upside as long as Bitcoin’s price stays inside this range.
BTC/USD rema bullish on the daily timeframe
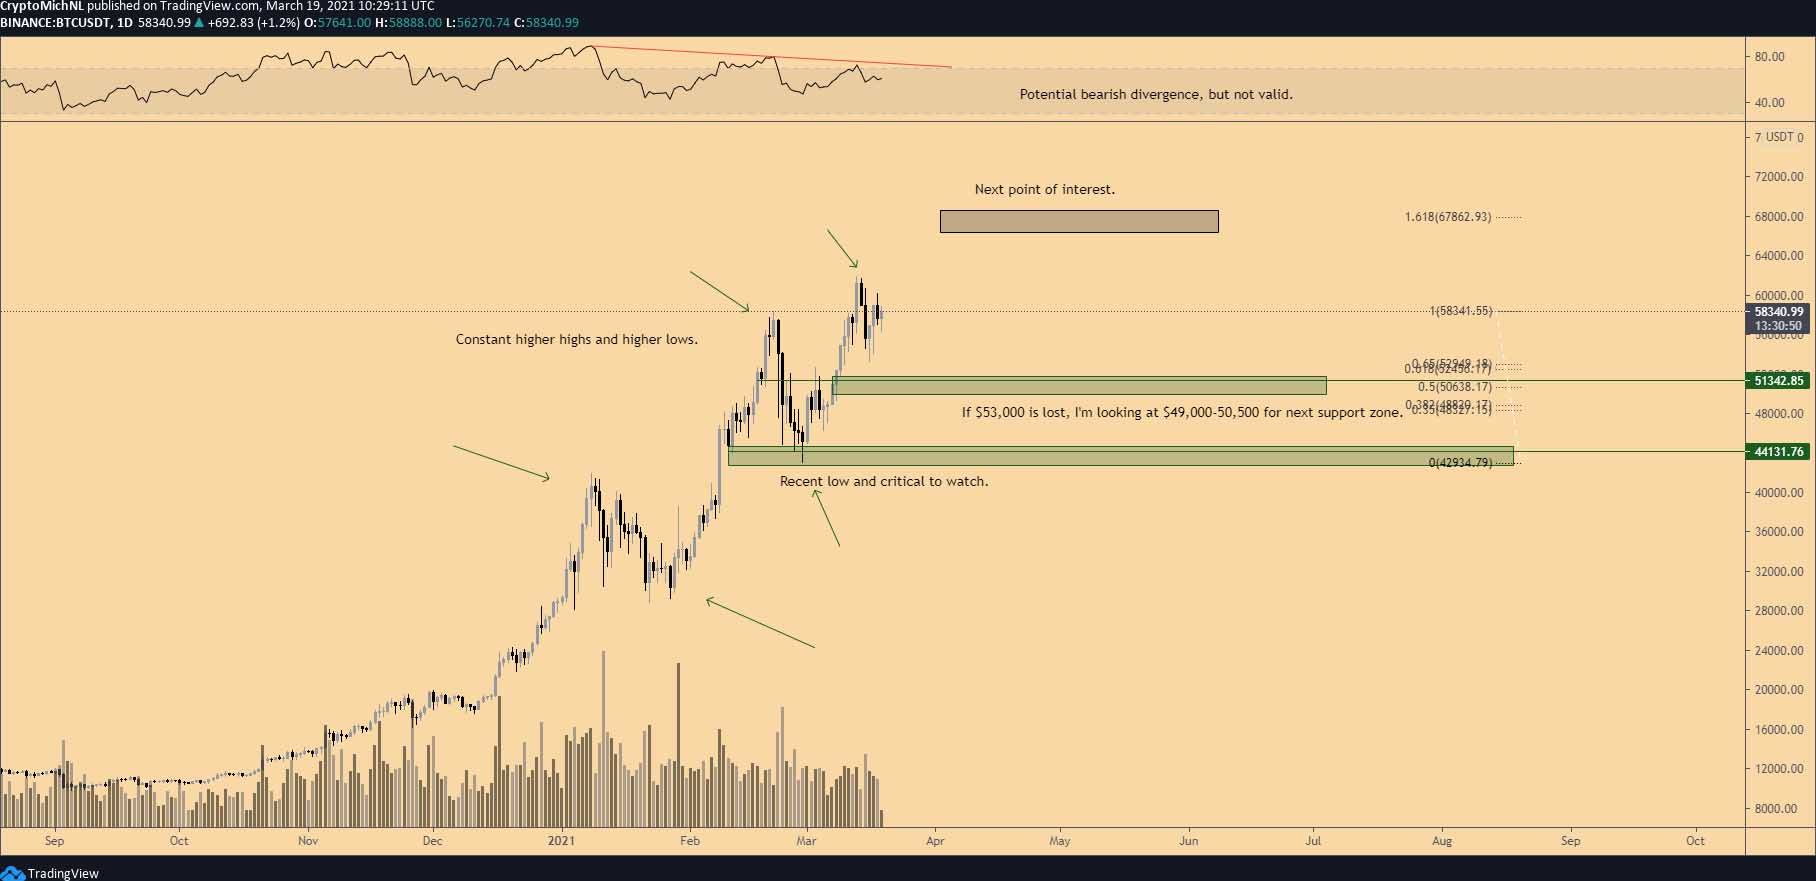
BTC/USDT 1-day chart. Source: TradingView
The daily chart for BTC/USD shows a strong uptrend, which has been the case for six months. This has been confirmed through higher lows and higher highs. As the recent low was created at $42,000, any price above this level means that the bull market is not in danger.
On the other hand, the RSI indicator shows a bearish divergence albeit still invalid. The bearish divergence becomes valid once previous resistance zones turn into resistances once again, but more importantly, once the price of Bitcoin starts to make lower lows.
Hence, the $50,000 region is a crucial area to watch as that should become the new higher low region. However, even if $50,000 is lost, the final anchor of support can be found at $42,000 and the 21-Week MA.
As long as these regions hold, the uptrend should continue. This should bring Bitcoin’s price to $68,000, as that’s the next Fibonacci level to watch.
Total crypto market cap eyes $2 trillion
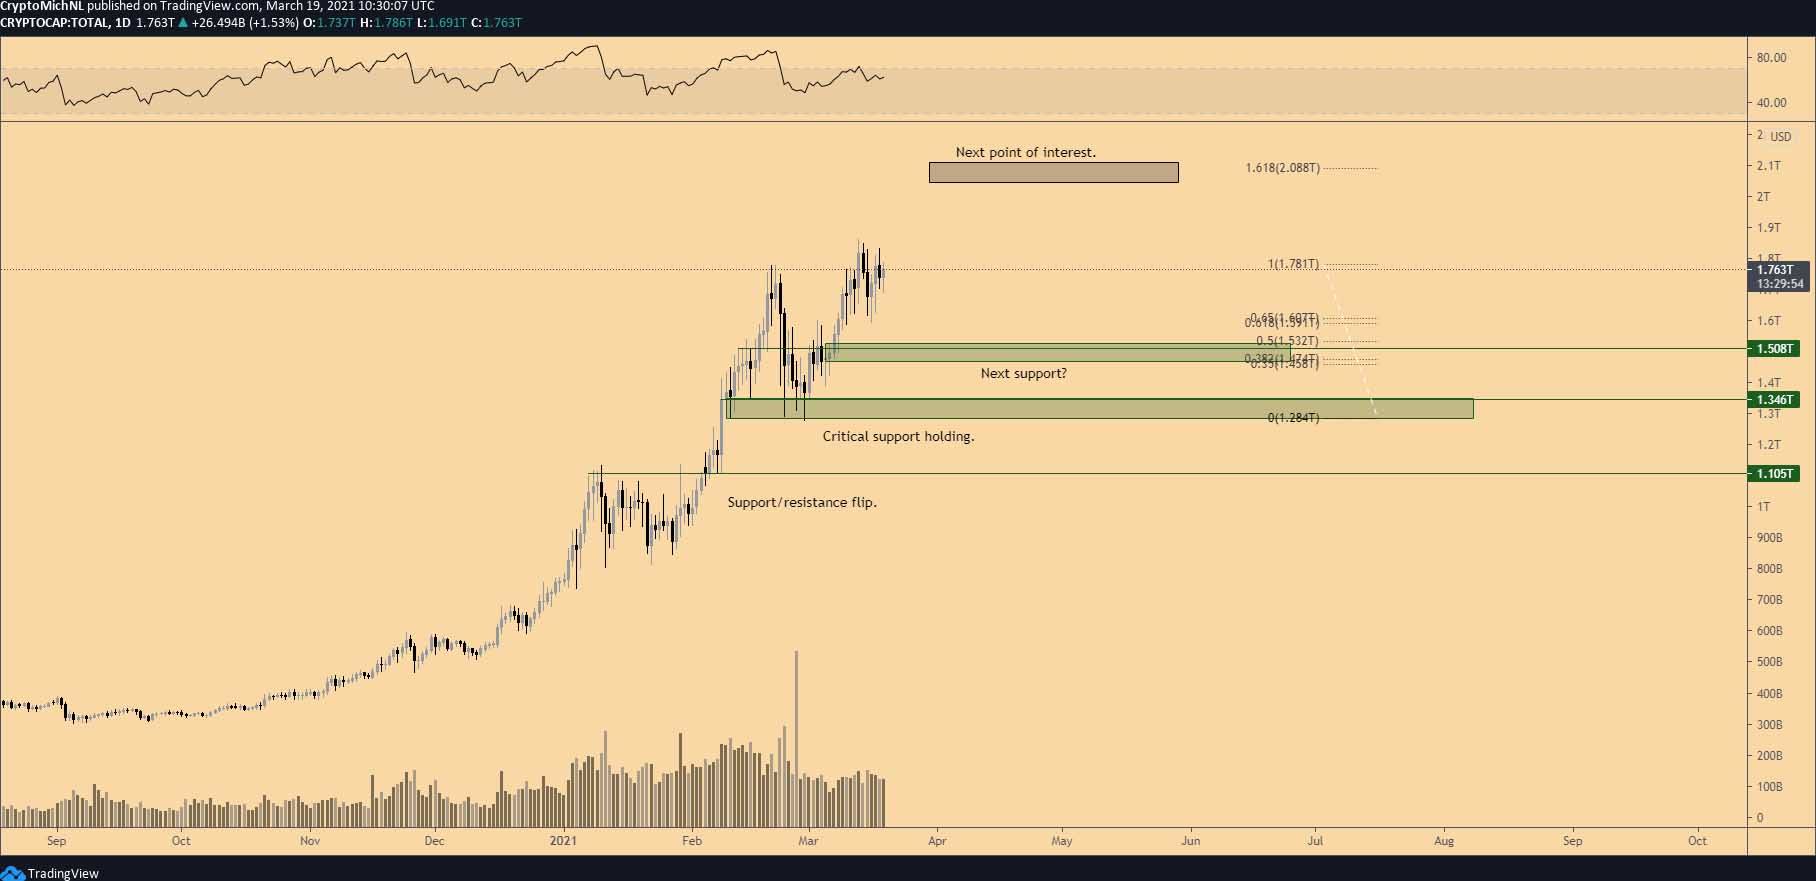
Total market capitalization crypto 1-day chart. Source: TradingView
The daily chart for the total cryptocurrency market capitalization shows a similar structure to Bitcoin’s price.
In this regard, the crucial support to hold is the $1.5 trillion level. As long as it holds, continuation toward $2 trillion is very likely. The next Fibonacci level is found between $2 and $2.1 trillion, or almost three times higher than the previous all-time high in 2017.
Potential scenario for Bitcoin
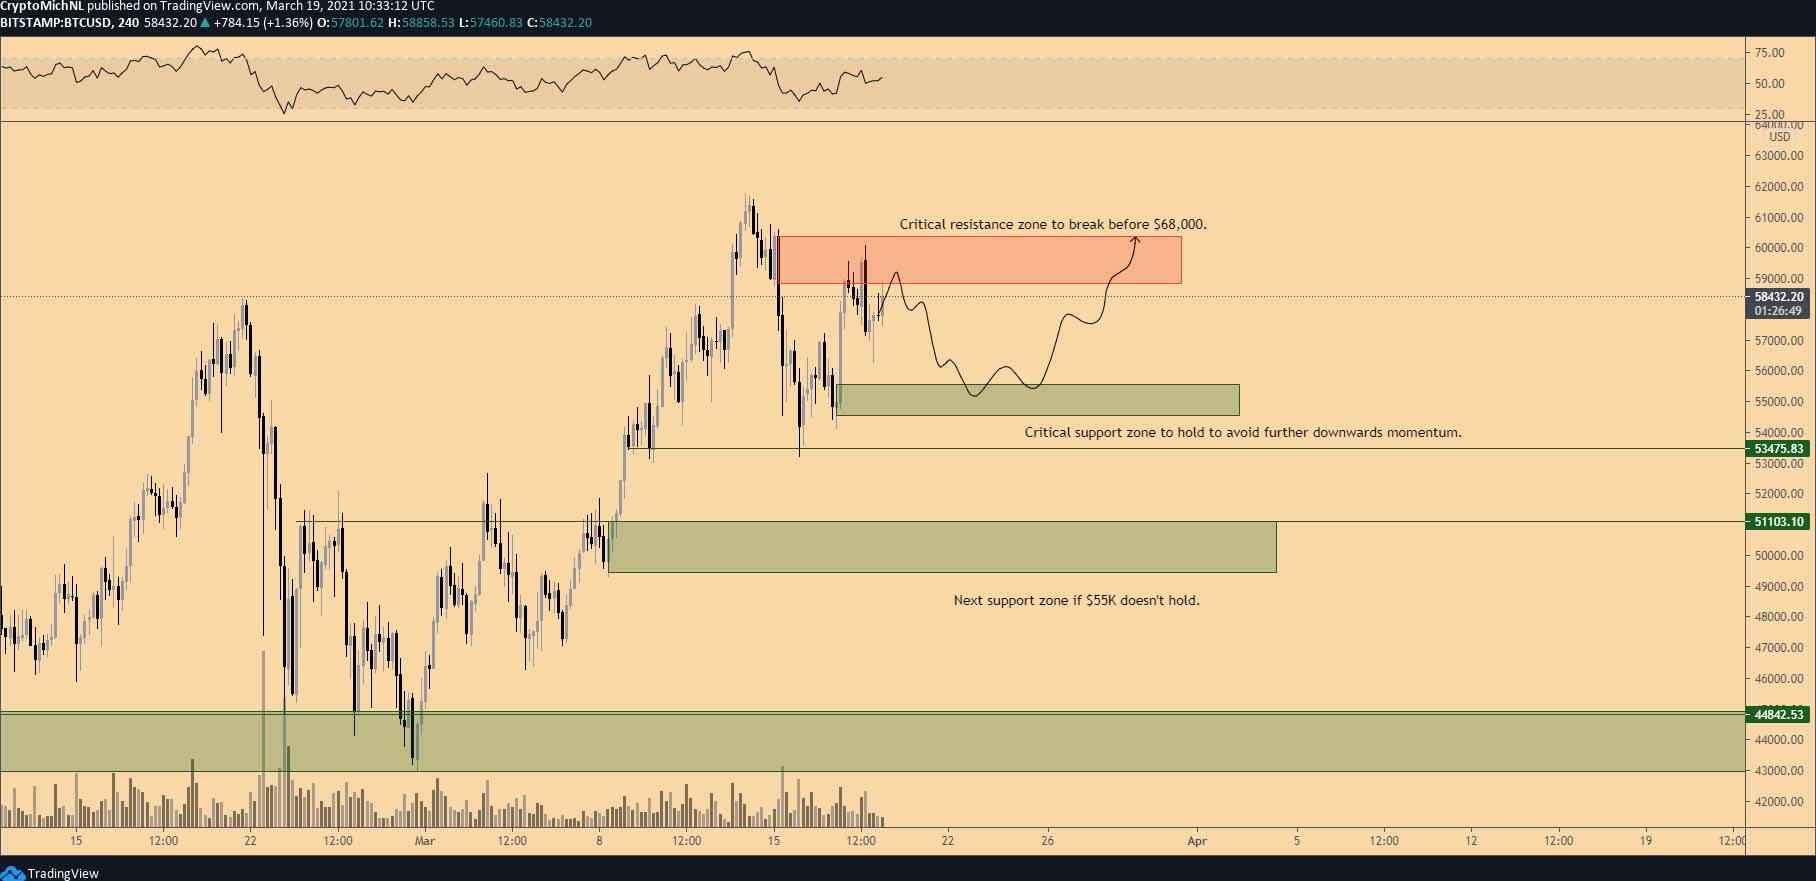
BTC/USD 4-hour chart. Source: TradingView
A possible scenario for Bitcoin’s price is further sideways action as BTC/USD compresses. To do this, the market will need to retest the aforementioned support and resistance levels of the current range.
After these tests, consolidation will be completed and a new impulse wave can begin. In that regard, the $60,000 barrier may serve as resistance for some time. Thus, a retest of the $55,000 region is on the table as long as $60,000 acts as resistance.
Holding the $55,000 support level will open the door to $68,000 as the next point of interest.
Author

Cointelegraph Team
Cointelegraph
We are privileged enough to work with the best and brightest in Bitcoin.


