Bitcoin price analysis: It indeed is a long term breakdown
- BTC breaks down on the long term chart.
- Recent lows at the risk of breaching.

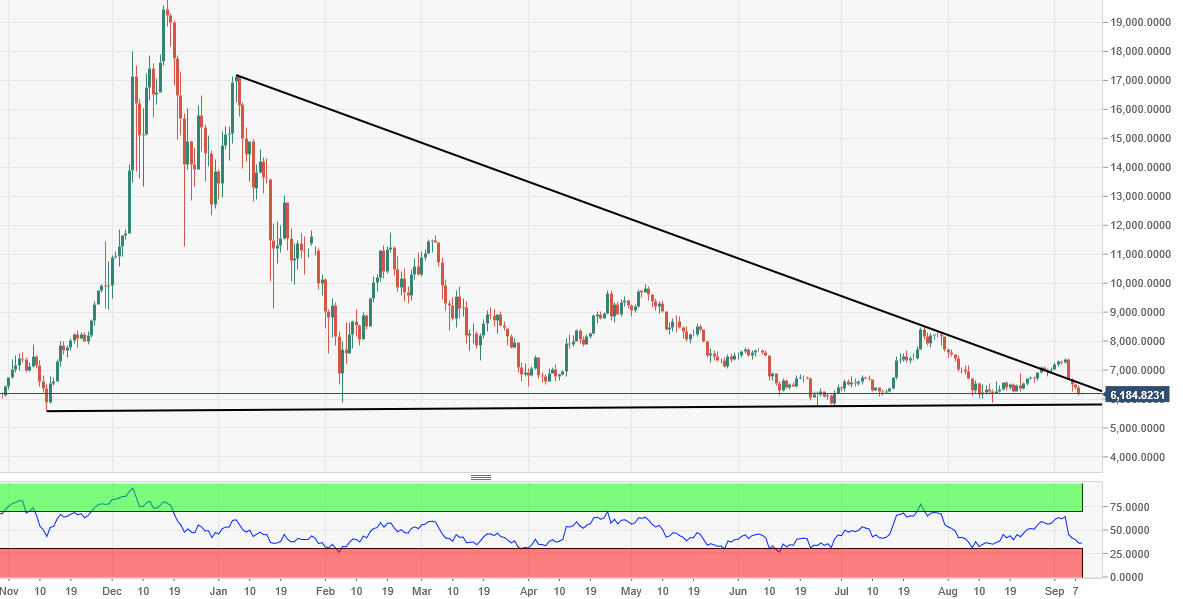
Bitcoin, the poster boy of cryptocurrency world, which managed to break out for a while, gave a false signal on the upside and has now broken down of a critical long term support line which would mean prices breaking lower of the recent lows.
BTC/USD is trading flat on day at $6,185 and in less than 1 percent range for the day which is the only positive that can be taken out of this breakdown for the bulls, the fact that volumes and volatility is lower in this breakdown.
But if this breakdown indeed proves right, then in all likelihood recent lows of the largest crypto won't hold but it may still try and find support around the long term support line that has been rescuing bulls from the jaws of death.
BTC/USD daily chart:
Get 24/7 Crypto updates in our social media channels: Give us a follow at @FXSCrypto and our FXStreet Crypto Trading Telegram channel
Author

Manoj B Rawal
Independent Analyst
Manoj B Rawal, financial markets professional with about 11 years of experience in writing, editing and advising on stocks, currencies and fixed income.


