Bitcoin price analysis: Downside opening up towards November lows
- Bitcoin consolidates the drop to 2.5-week lows on Sunday.
- The coin remains vulnerable amid bearish technical set up.
- 7,200 is the level to beat for the bulls in the near-term.

The bears take a breather over the last hours, allowing a brief consolidation phase in Bitcoin (BTC/USD), the most favorite cryptocurrency, having reached the lowest levels in two-and-a-half weeks at 7,007 in early trading this Sunday. At the time of writing, the spot trades around 7,050, losing -2.50% over the last 24 hours while down nearly 5.50% on a weekly basis. Its market capitalization decreased to $ 128.79 billion from $ 130.73 billion seen in Saturday’s European hours.
Friday’s bounce in the no. 1 coin was proved as a dead cat bounce after sellers returned on Saturday amid overall bearish short-term market sentiment, as the technical outlook has turned outrightly negative for the widely traded digital asset, Bitcoin.
Technical Overview
BTC/USD 1-hour chart
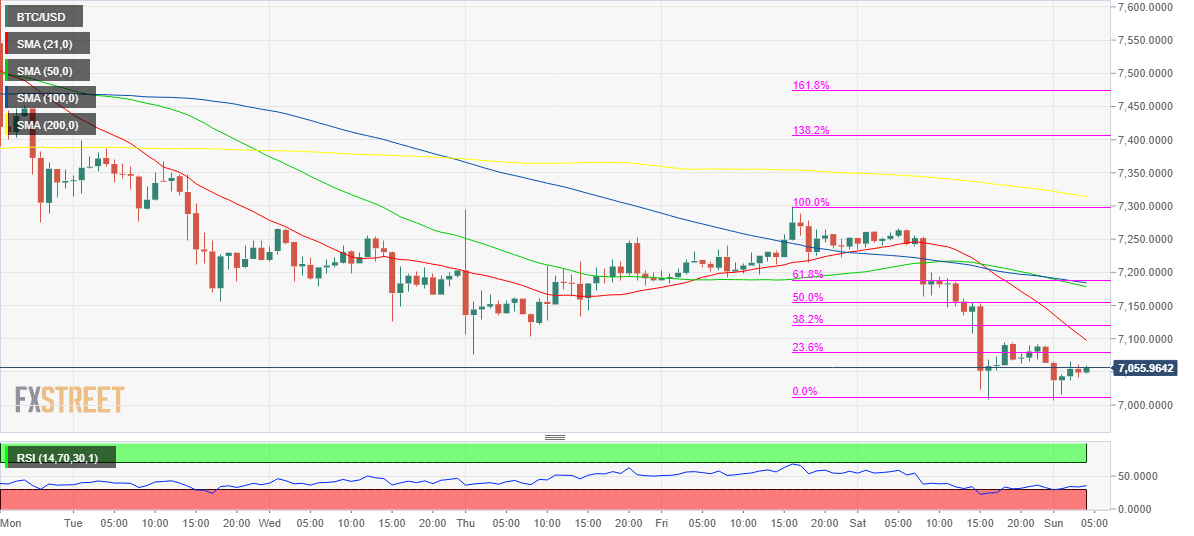
Following a rising wedge pattern breakdown (bearish reversal pattern) was confirmed on the hourly chart Saturday, the price saw sharp declines and reached the pattern target at 7,075. The selling interest remained unabated and in fact intensified after the 21- hourly Simple Moving Averages (HMA) breached the 50 and 100-HMA from above, driving the coin to test the 7k mark on several occasions. Despite a brief pause in the sell-off, any upside attempts are likely to get sold-off into the stiff resistance between the 7,080 and 7,100 levels, the confluence of the 23% Fibonacci Retracement level (Fib) of the latest decline and the bearish 21-HMA. Also, the hourly Relative Strength Index (RSI) has further room to fall as it still lies above the oversold territory.
BTC/USD daily chart
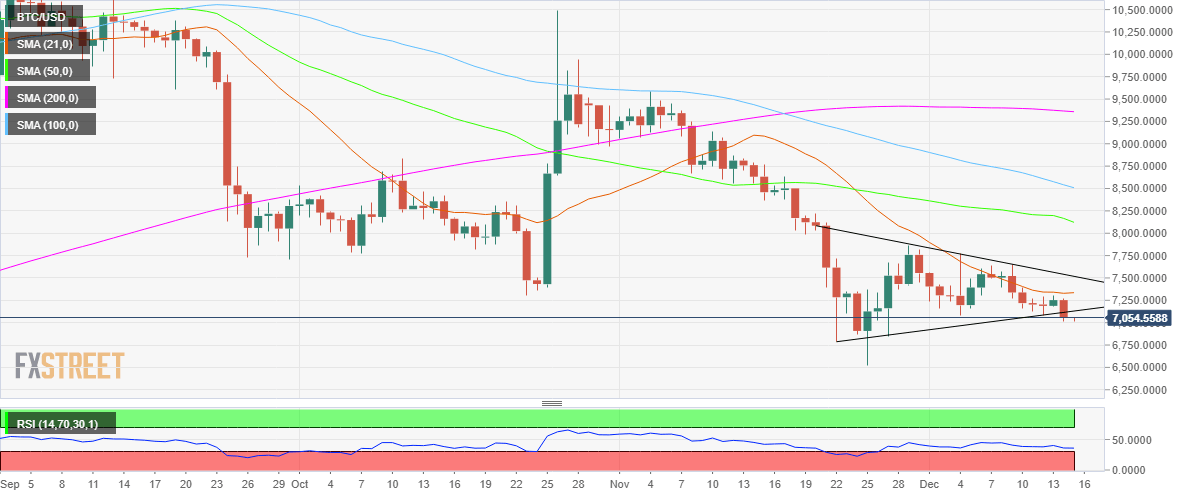
Looking at the bigger picture, BTC/USD confirmed a symmetrical triangle breakdown on the daily sticks on Saturday, having closed below the pattern trendline support of 7,115. Therefore, the bears now have their eyes set on the pattern target that is aligned around 6,100 levels and could be reached over the next few weeks. The November lows of 6,526.81 could offer some interim support to the price, with a minor Santa rally back to the 7k threshold cannot be ruled before sellers take over again.
All in all, ‘Sell the bounce’ looks like the Bitcoin story for now.
BTC/USD Levels to watch
Author

Dhwani Mehta
FXStreet
Residing in Mumbai (India), Dhwani is a Senior Analyst and Manager of the Asian session at FXStreet. She has over 10 years of experience in analyzing and covering the global financial markets, with specialization in Forex and commodities markets.


