Bitcoin Price Analysis: BTC/USD at risk to breakout from a rising wedge structure
- Bitcoin price is trading in negative territory, down 0.40% in the second half of the session.
- BTC/USD have enjoyed two straight sessions of gains, however, there are signs of a slowdown.
- There is a big barrier of resistance observed at $10,500.

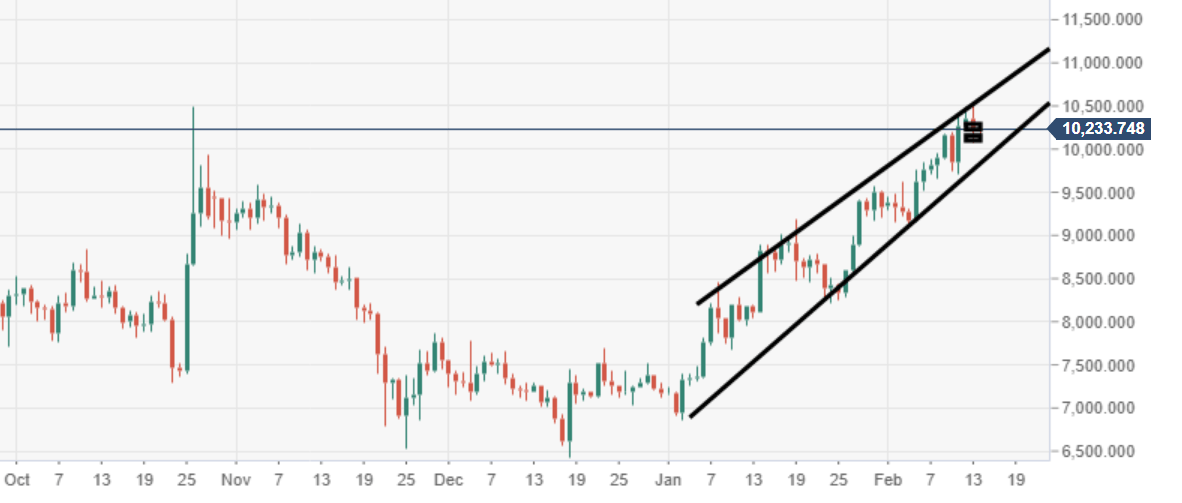
BTC/USD daily chart
Price action is moving within a rising wedge structure via the daily, subject to potential breakout to the downside.
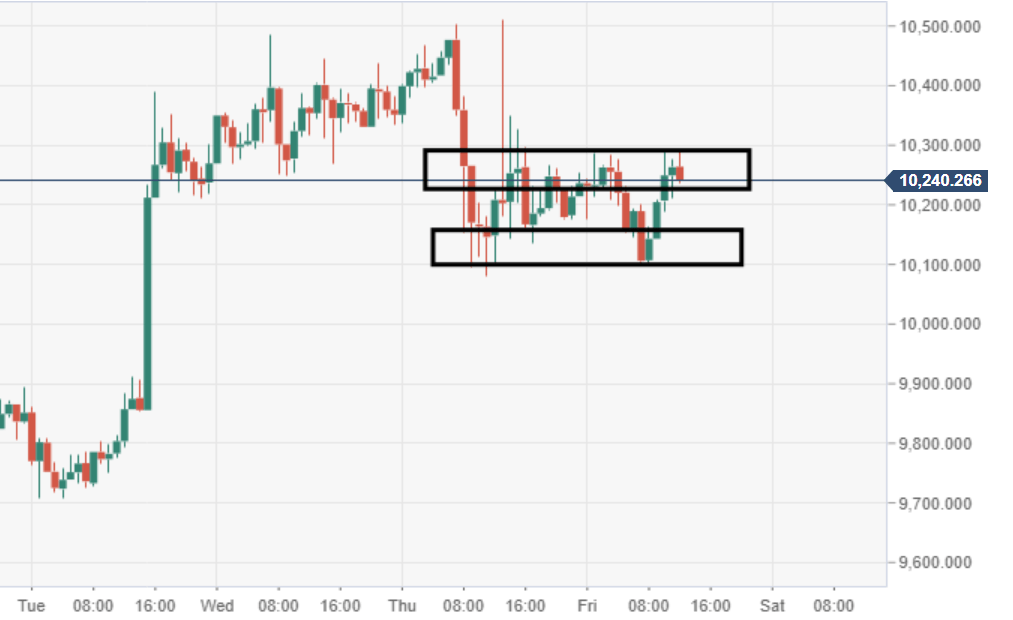
BTC/USD 60-minute chart
The price has been sucked back within a narrowing range via the 60-minute chart, the high at $10,300 down to $10,100.
Spot rate: 10,270.20
Relative change: -0.40%
High: 10,511.86
Low: 10,08.12
Author

Ken Chigbo
Independent Analyst
Ken has over 8 years exposure to the financial markets. He started his career as an analyst, covering a variety of asset classes; forex, fixed income, commodities and equities.
More from Ken Chigbo


