|

Bitcoin perfectly reacting higher from Elliott Wave blue box area

In this technical blog, we will look at the past performance of the Daily Elliott Wave Charts of Bitcoin ticker symbol: $BTCUSD. We presented to members at the elliottwave-forecast. In which, the rally from the 21 November 2022 low is unfolding as an impulse structure. Showing a higher high sequence favored more upside extension to take place. Therefore, we advised members not to sell the crypto & buy the dips in 3, 7, or 11 swings at the blue box areas. We will explain the structure & forecast below:

Bitcoin Daily Elliott Wave Chart From 6.30.2024

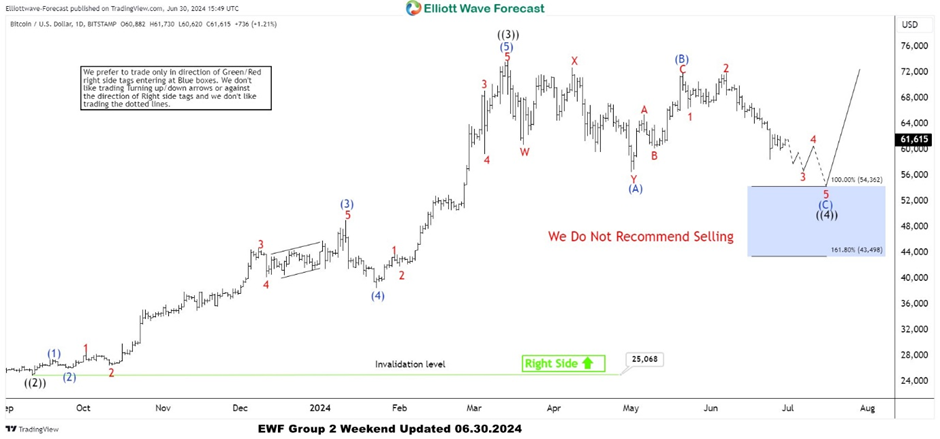
Here’s the Daily Elliott wave chart from the 6.30.2024 weekend update. In which, the cycle from the 9.11.2023 low ended in wave ((3)) at $73794 high. Down from there, the BTCUSD made a pullback in wave ((4)) to correct that cycle. The internals of that pullback unfolded as Elliott wave flat structure where wave (A) ended at $56500 low. Wave (B) bounce ended at $71958 high and wave (C) managed to reach the blue box area at $54362- $43498. From there, buyers were expected to appear looking for the next leg higher or for a 3 wave bounce minimum.

BTCUSD Latest Daily Elliott Wave Chart From 7.21.2024

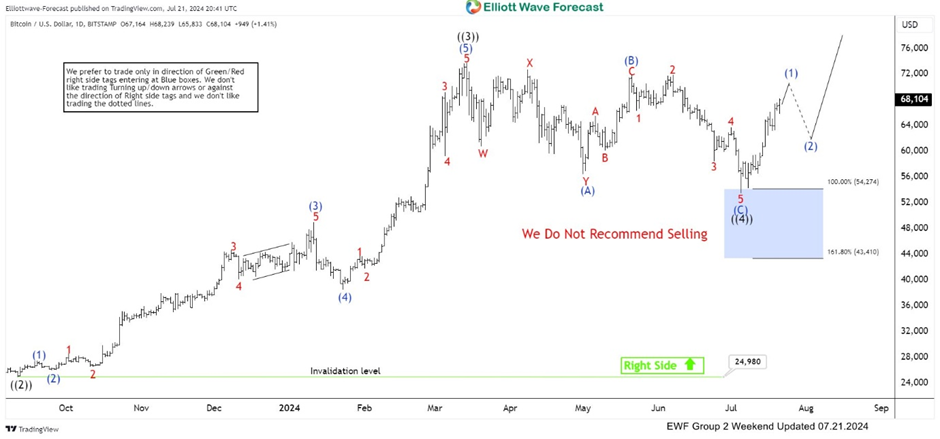
This is the latest Daily Elliott wave Chart from the 7.21.2024 update. In which the Bitcoin is showing a reaction higher taking place, right after ending the flat correction within the blue box area. Allowed members to create a risk-free position shortly after taking the long position at the blue box area. However, a break above $73794 high is still needed to confirm the next extension higher towards $78616- $86338 & avoid a double correction lower.

Author

Elliott Wave Forecast Team

Elliott Wave Forecast Team

ElliottWave-Forecast.com

More from Elliott Wave Forecast Team
Share:

Markets move fast. We move first.

Orange Juice Newsletter brings you expert driven insights - not headlines. Every day on your inbox.

By subscribing you agree to our Terms and conditions.

Editor's Picks

Pi Network Price Forecast: Bearish streak nears critical support trendline

Pi Network (PI) edges lower on Friday for the third consecutive day, approaching a local support trendline. The on-chain data suggests an increase in supply pressure as Centralized Exchanges (CEXs) experience a surge in inflows.

Top Crypto Gainers: Zcash rallies as MYX Finance, Dash test critical EMA levels

Zcash , MYX Finance, and Dash are the top-performing assets in the top 100 cryptocurrency list over the last 24 hours. The privacy coin leads the rally while MYX and DASH struggle to clear their 100-day Exponential Moving Averages (EMA).

XRP slides amid record on-chain activity, mixed technical signals

Ripple is trading under pressure at the time of writing on Thursday, after bulls failed to break the short-term resistance at $2.22. The reversal may extend toward Monday’s low of $1.98, especially if risk-off sentiment persists in the broader cryptocurrency market.

Aster lags recovery as perpetual DEX releases new roadmap on infrastructure, utility and ecosystem 

Aster is consolidating above $1.05 at the time of writing on Thursday, reflecting lethargic sentiment in the broader cryptocurrency market. The token native to the perpetual DEX had recovered from Monday's low of $0.88 but stalled around $1.08 on Wednesday.

Orange Juice Newsletter – Smart insights by real people. Every day.

A free newsletter highlighting key market trends to help traders stay a step ahead. Daily insights on the most relevant trading topics, compiled by our experts in an easy-to-read format so you never miss an important move.

Bitcoin: BTC steadies as data suggests local bottom

Bitcoin (BTC) hovers around $91,000 at the time of writing on Friday, extending its recovery by 5% so far this week. On the institutional front, a modest outflow from US-listed spot Bitcoin Exchange Traded Funds (ETFs) marks a slowdown from previous weeks and signals a reduction in selling pressure, further supporting BTC’s recovery.