Bitcoin found sellers after Elliott Wave zig zag pattern

In this technical blog we’re going to take a quick look at the Elliott Wave charts of Bitcoin ( BTCUSD). As our members know, Bitcoin is correcting the cycle from the 25068 low, and we have been predicting a price decline. Recently, we observed a bounce against the June 7th peak. This recovery formed an Elliott Wave Zig Zag Pattern. In the following text, we will explain the Elliott Wave Pattern and the forecast.
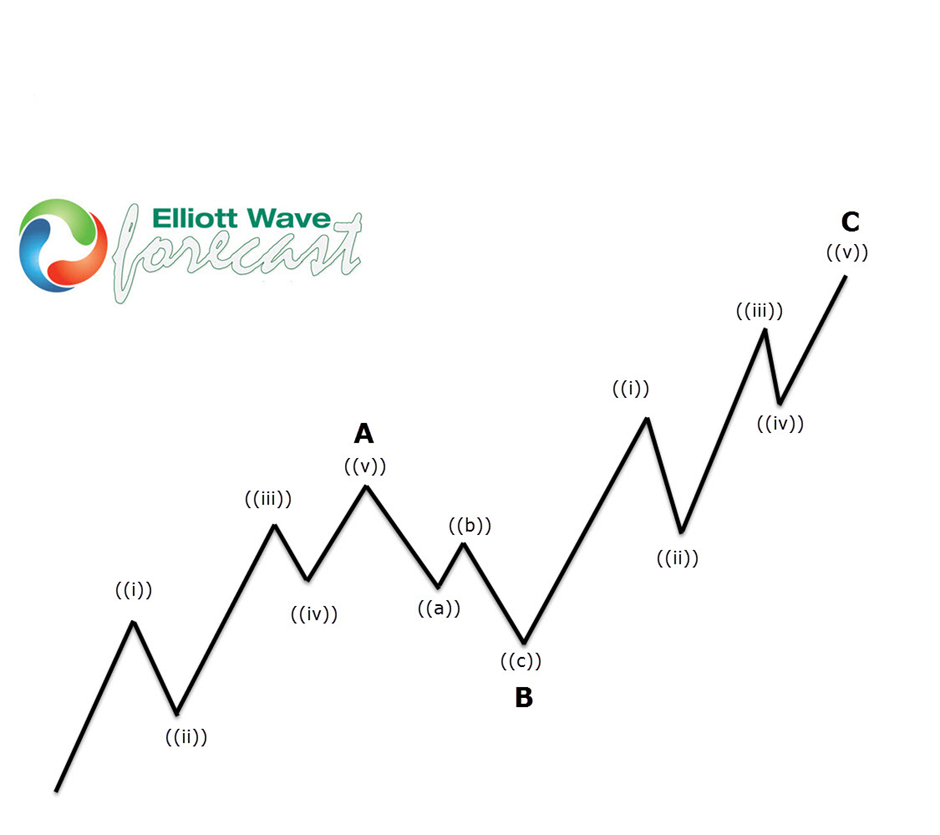
Before we take a look at the real market example, let’s explain Elliott Wave Zigzag pattern.
Elliott Wave Zigzag is the most popular corrective pattern in Elliott Wave theory . It’s made of 3 swings which have 5-3-5 inner structure. Inner swings are labeled as A,B,C where A =5 waves, B=3 waves and C=5 waves. That means A and C can be either impulsive waves or diagonals. (Leading Diagonal in case of wave A or Ending in case of wave C) . Waves A and C must meet all conditions of being 5 wave structure, such as: having RSI divergency between wave subdivisions, ideal Fibonacci extensions and ideal retracements.
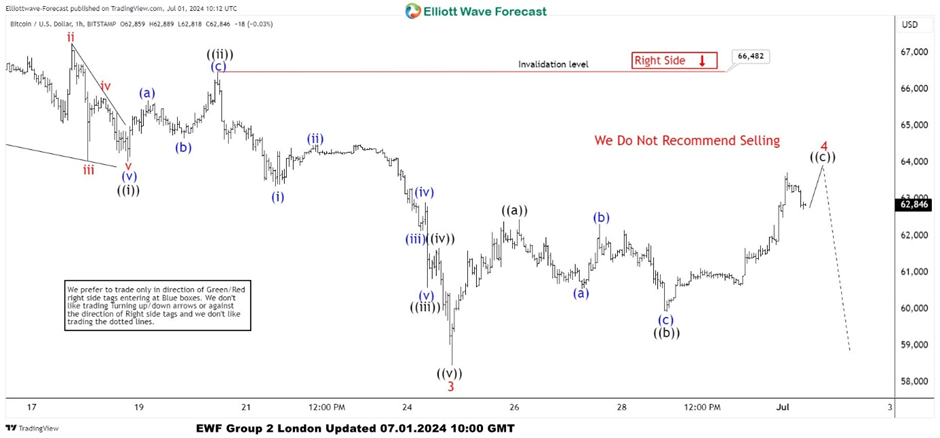
BTC/USD hour-one Elliott Wave analysis 07.01.2024
BTCUSD is showing incomplete sequences in the cycle from the 79.791 peak, suggesting we should get at least another leg down to complete 5 waves in the proposed cycle. The current view suggests Wave 4 red correction appears to be unfolding as an Elliott Wave Zig Zag pattern. The first leg ((a)) of 4 looks like a 5-wave pattern, after which we got a clear 3-wave pullback in ((b)) black. Currently, we are in the ((c)) leg, which also has the form of a 5-wave pattern. Another short-term high would be ideal to complete 5 waves within the ((c)) leg and Wave 4 red recovery as an Elliott Wave Zig Zag pattern. We don’t recommend buying the cryptocurrency at this stage and expect to see a decline toward new lows ideally.
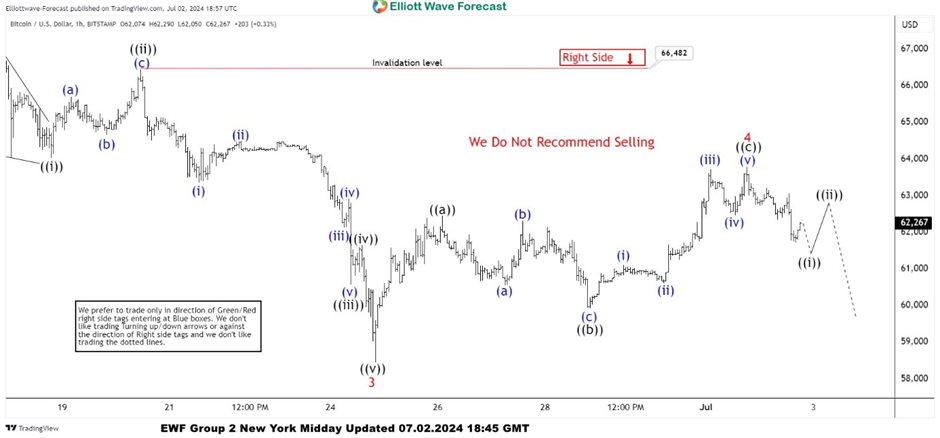
BTC/USD hour-one Elliott Wave analysis 07.02.2024
The cryptocurrency made another short-term high before declining as expected. The Wave 4 red recovery completed at the 63846 high. As long as Bitcoin remains below that peak, we expect it to continue finding sellers and extend toward new lows, targeting 57207-55166 area.
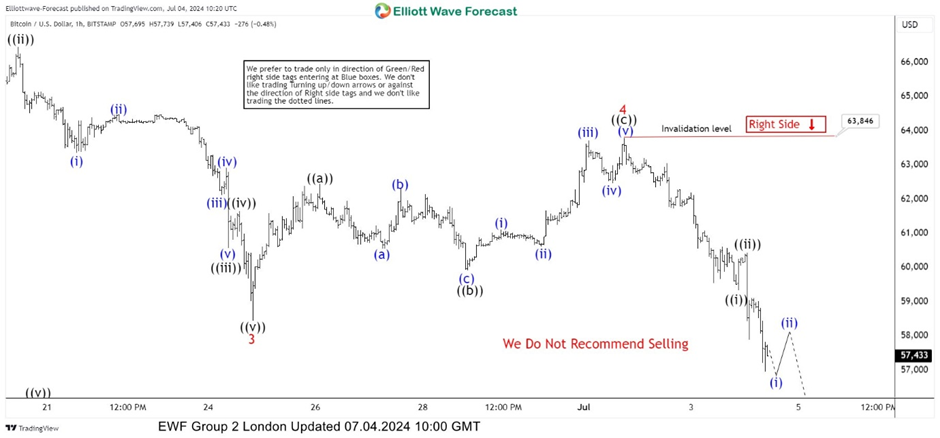
BTC/USD hour-one Elliott Wave analysis 07.04.2024
Eventually, the price made a further decline. Bitcoin broke the previous low and reached the first target area at 57207-55166 as we expected. The cryptocurrency remains bearish against the 63846 pivot.
Author

Elliott Wave Forecast Team
ElliottWave-Forecast.com


