Bitcoin forms bullish RSI divergence just in time for US CPI

A technical analysis pattern hinting at bull reversal has appeared on Bitcoin's (BTC) daily price chart as market participants look to Wednesday's U.S. inflation data to put a floor under risk assets.
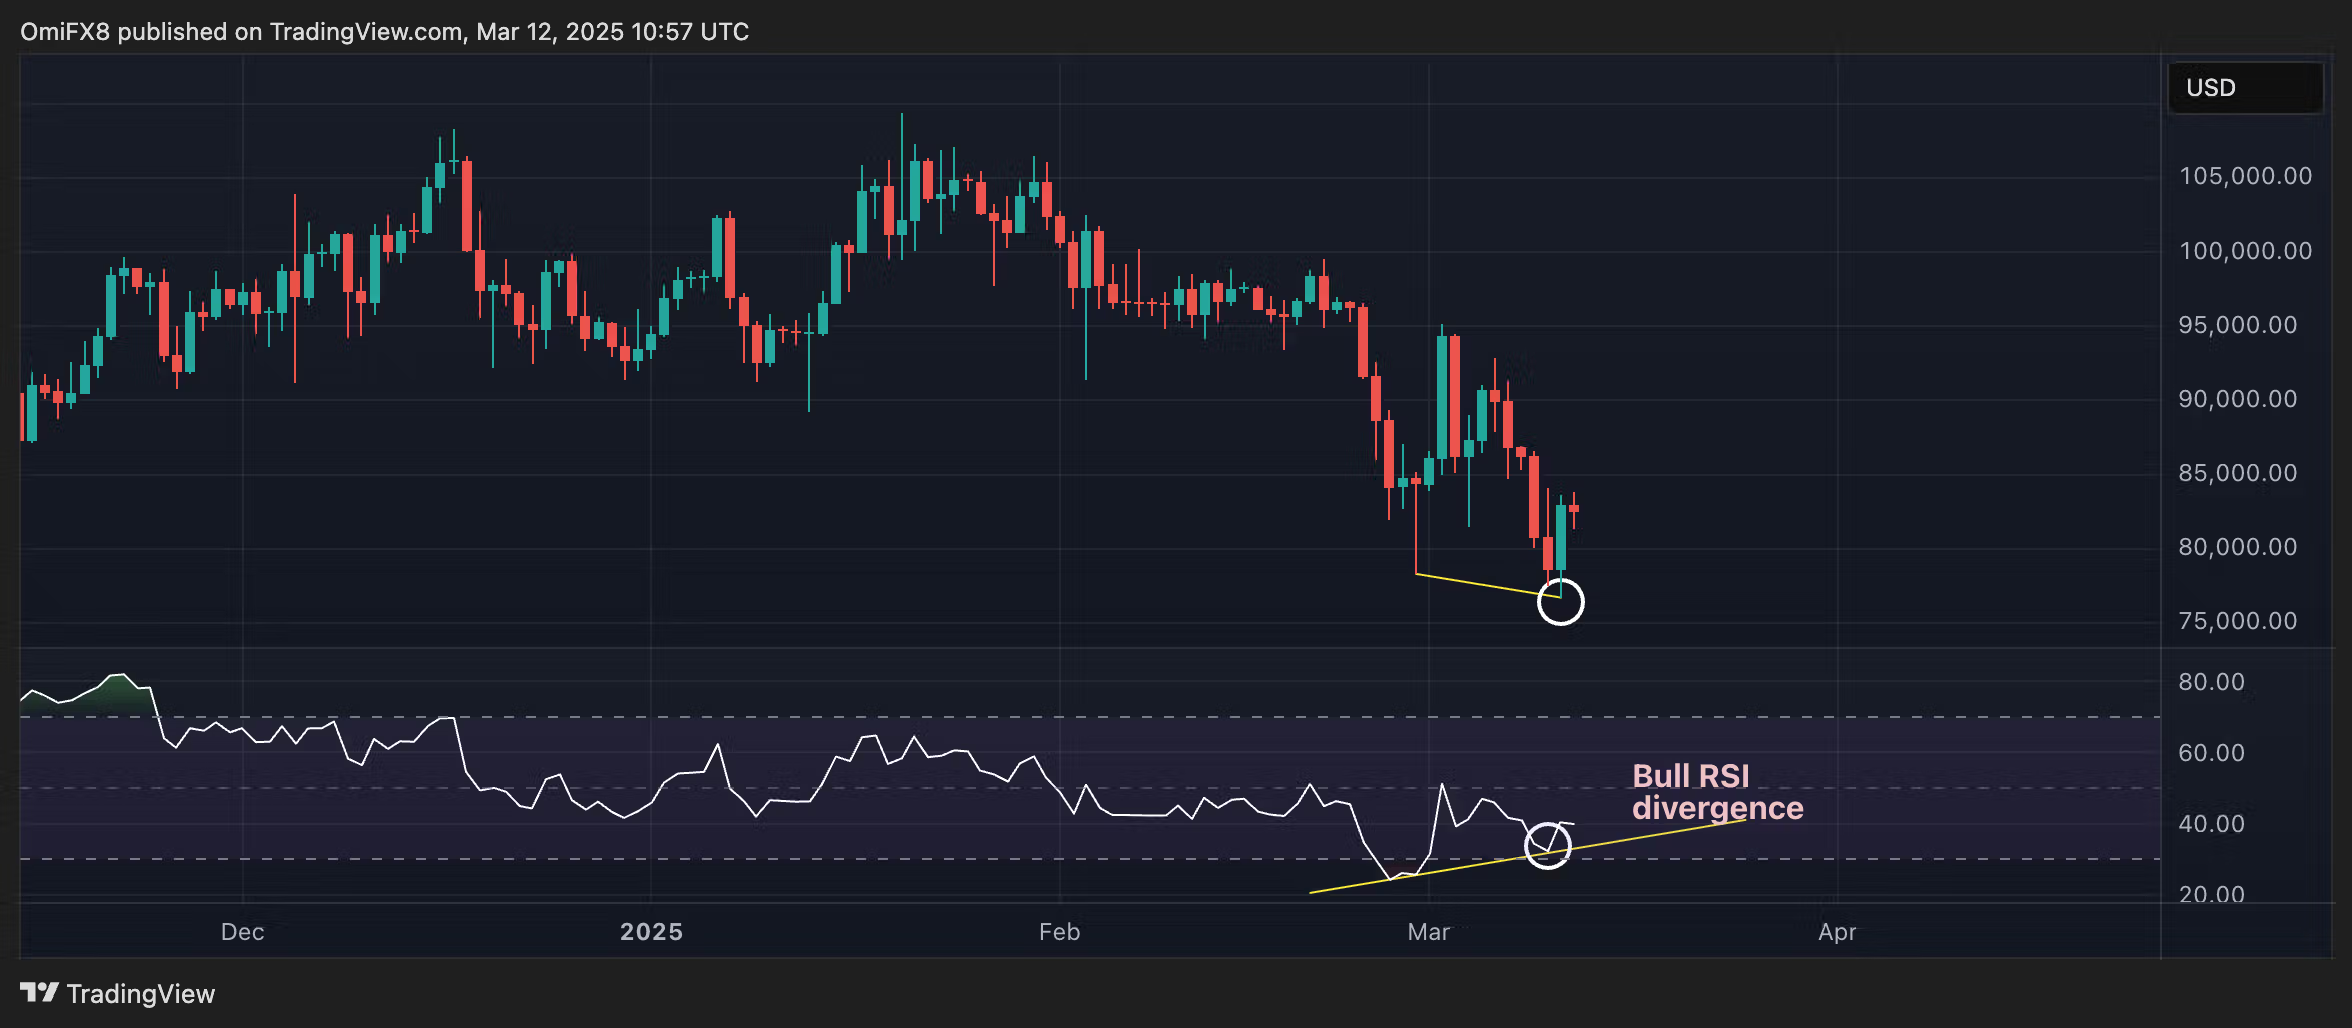
BTC has recently taken a beating, falling from $100,000 last month to under $80,000 this week due to several factors, including risk aversion on Wall Street, concerns about Trump's tariffs and U.S. recession fears. The disappointment over the lack of fresh BTC purchases under Trump's strategic reserve plan added to the downward momentum.
However, as prices fell to multi-month lows below $80,000 on Tuesday, the relative strength index (RSI)—a widely followed momentum oscillator—did not confirm this decline. The indicator produced a higher low, contradicting the lower low on the price chart, confirming what is known as the bullish RSI divergence.
It indicates that while the price is going down, the momentum behind the selling is weakening, potentially signaling an upcoming reversal to a bullish trend.
The pattern couldn't have come at a more interesting time than today, as the U.S. consumer price index for February, scheduled for release at 12:30 UTC, is expected to show progress. BTC's bullish divergence of the RSI means the stage is set for a positive response to a potential soft reading.
According to CNBC, the data is expected to show that the headline CPI and the core figure, which excludes food and energy, increased by 0.3% month-on-month in February. That implies an annualized reading of 2.9% for the headline CPI and 3.2% for the core, both 0.1 percentage point lower than in January.
"Tonight’s CPI print could set the tone for rate expectations, as markets now price in four Fed cuts this year, up from just one in January. Will inflation data validate this shift or bring fresh turbulence?," Singapore-based crypto trading firm QCP Capital said in a Telegram broadcast.
Author

CoinDesk Analysis Team
CoinDesk
CoinDesk is the media platform for the next generation of investors exploring how cryptocurrencies and digital assets are contributing to the evolution of the global financial system.


